Over the last 18 months we’ve worked with 66 fantastic authors, and many other contributors, reviewers and editorial board members, to pull together a review of the last decade of activity on open data. The resulting collection provides short essays that look at open data in different sectors, fromaccountability and anti-corruption, to the environment, land ownership and international aid, as well as touching on cross-cutting issues, differentstakeholder perspectives, and regional experiences. We’ve tried to distill key insights in overall and section introductions, and to draw out some emerging messages in an overall conclusion.
This has been my first experience pulling together a whole book, and I’m incredibly grateful to my co-editors, Steve Walker, Mor Rubinstein, and Fernando Perini, who have worked tirelessly over the project to bring together all these contributions, make sure the project is community driven, and to present a professional final book to the world, particularly in what has been a tricky year personally. The team at our co-publishers, African Mindsand IDRC (Simon, Leith, Francois and Nola) also deserve a great debt of thanks for their attention to detail and design.
I’ll ty and write up some reflections and learning points on the book process in the near future, and will be blogging more about specific elements of the research in the coming weeks, but for now, let me share the schedule of upcoming events in case any blog readers happen to be able to join. I’ll aim to update these with links to any outcomes from the sessions too later.
Roundtable at the Harvard Berkman Klein Center, with chapter authors David Eaves, Mariel Garcia Montes, Nagla Rizk, and response from Luminate’s Laura Bacon.
I’ll be connecting via hangouts to explore the connections between data literacy, artificial intelligence, and private sector engagement with open data
A panel discussion as part of the World Bank Let’s Talk Data series, exploring the development of open data over the last decade. This session will also be webcast – see detail in EventBrite.
We’ll be bringing together authors from lots of different chapters, including Shaida Baidee (National Statistics), Catherine Weaver (Development Assistance & Humanitarian Action), Jorge Florez (Anti-corruption), Alexander Howard (Journalists and the Media), Joel Gurin (Private Sector), Christopher Wilson (Civil Society) and Anders Pedersen (Extractives) to talk about their key findings in an informal world cafe style.
I’m joining Tariq Khokhar, Managing Director & Chief Data Scientist, Innovation, The Rockefeller Foundation, Adrienne Schmoeker, Deputy Chief Analytics Officer, City of New York and Beth Simone Noveck, Professor and Director, The GovLab, NYU Tandon (and also foreword writer for the book), to discuss changing approaches to data sharing, and how open data remains relevant.
[Summary: Over the next few months I’m working with Create Gloucestershire with a brief to catalyse a range of organisational data projects. Amongst these will be a hackathon of sorts, exploring how artists and analysts might collaborate to look at the cultural education sector locally. The body of this post shares some exploratory groundwork. This is a variation cross-posted from the Create Gloucestershire website.]
Create Gloucestershire have been exploring data for a while now, looking to understand what the ever-increasing volume of online forms, data systems and spreadsheets arts organisations encounter every day might mean for the local cultural sector. For my part, I’ve long worked with data-rich projects, focussing on topics from workers co-operatives and youth participation, to international aid and corruption in government contracting, but the cultural sector is a space I’ve not widely explored.
Often, the process of exploring data can feel like a journey into the technical: where data stands in opposition to all things creative. So, as I join CG for the next three months as a ‘digital catalyst’, working on the use of data within the organisation, I wanted to start by stepping back, and exploring the different places at which data, art and creativity meet with an exploratory blog post..
…and a local note on getting involved…
In a few weeks (late February 2019) we’ll be exploring these issues through a short early-evening workshop in Stroud: with a view to hosting a day-long data-&-art hackathon in late Spring. If you would like to find out more, drop me a line.
Post: Art meets data | Data meets art
For some, data and art are diametrically opposed. Data is about facts. Art about feelings.
Take a look at writings from the data visualisation community [1], and you will see some suggest that data art is just bad visualisation. Data visualisation, the argument runs, uses graphical presentation to communicate information concisely and clearly. Data art, by contrast, places beauty before functionality. Aesthetics before information.
Found on Flickr: “I’m not even sure what this chart says … but I think its gorgeous!” (Image CC-BY Carla Gates / Original image source: ZSL)
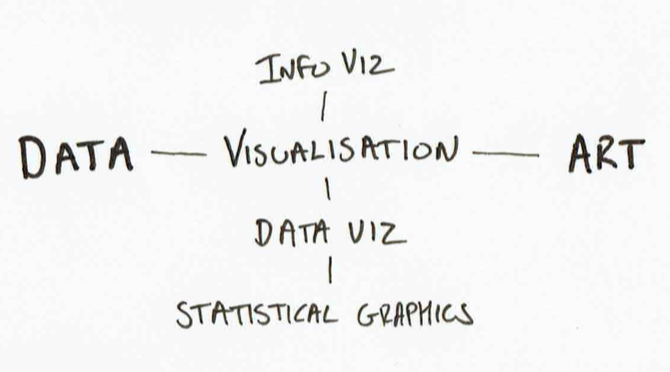
I prefer to see data, visualisation and art all as components of communication. Communication as the process of sharing information, knowledge and wisdom.
The DIKW pyramid proposes a relationship between Data, Information, Knowledge and Wisdom, in which information involves the representation of data into ‘knowing that’, whilst knowledge requires experience to ‘know how’, and wisdom requires perspective and trained judgement in order to ‘know why’. (Image CC BY-SA. Wikimedia Commons)
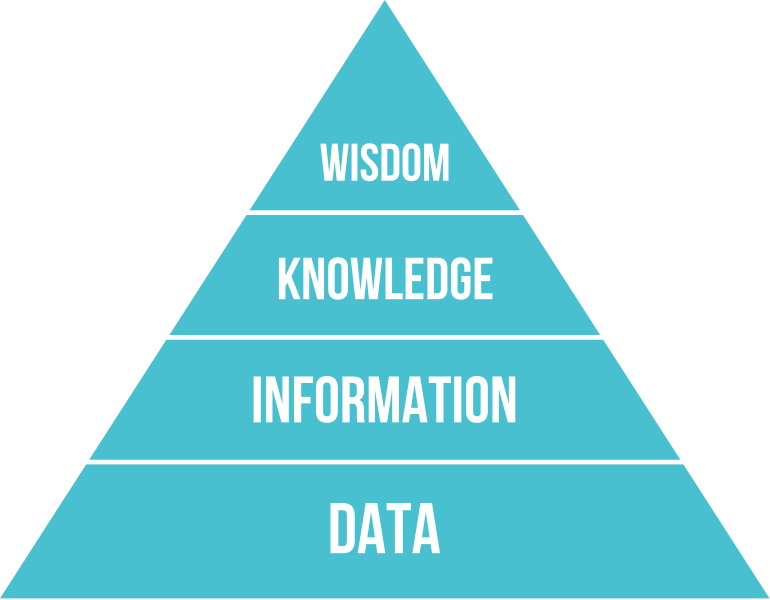
Turning data into information requires a process of organisation and contextualisation. For example, a collection of isolated facts may be made more informative when arranged into a table. That table may be made more easily intelligible when summarised through counts and averages. And it may communicate more clearly when visualisation is included.
An Information -> Data -> Information journey. GCSE Results in Arts Subjects. (Screenshots & own analysis)
But when seeking to communicate a message from the data, there is another contextualisation that matters: contextualising to the recipient: to what they already know, or what you may want to them to come to know. Here, the right tools may not only be those of analysis and visualisation, but also those of art: communicating a message shaped by the data, though not entirely composed of it.
Artistic expression could focus on a finding, or a claim from the data, or may seek to support a particular audience to explore, interrogate and draw interpretations from a dataset. (Image CC BY-SA Toby Oxborrow)
In our upcoming workshop, we’ll be taking a number of datasets about the state of cultural education in Gloucestershire, and asking what they tell us. We’ll be thinking about the different ways to make sense of the data, and the ways to communicate messages from it. My hope is that we will find different ways to express the same data, looking at the same topic from a range of different angles, and bringing in other data sources of our own. In that way, we’ll be able to learn together both about practical skills for working with data, and to explore the subjects the data represents.
In preparing for this workshop I’ve been looking at ways different practitioners have connected data and art, through a range of media, over recent years.
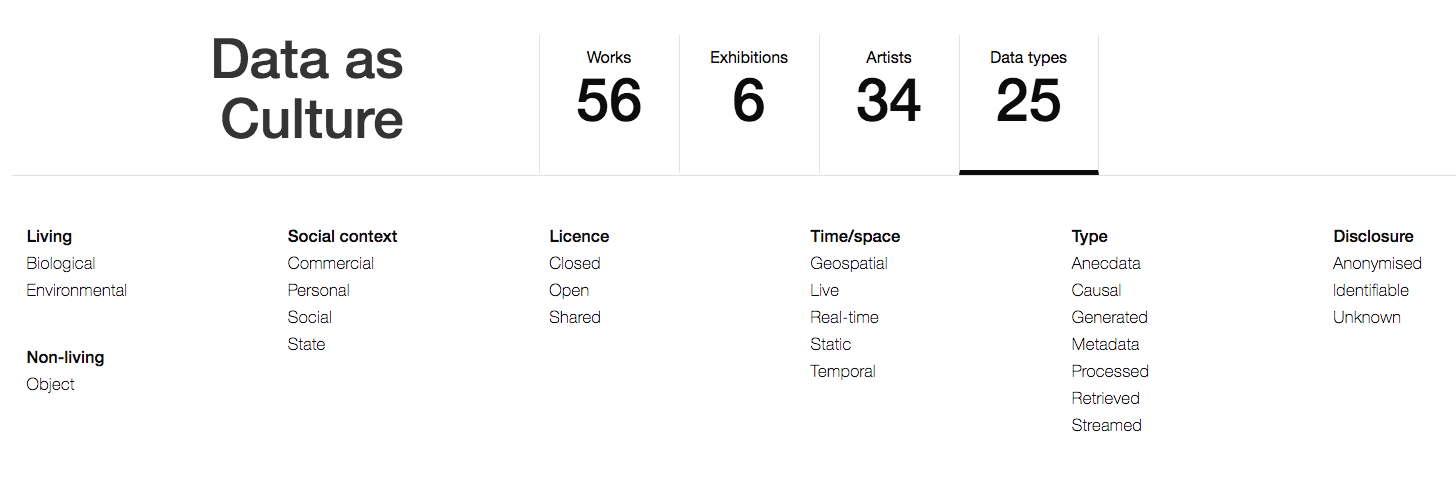
The Open Data Institute: Data as Culture
Since it’s inception, The Open Data Institute in London has run a programme called ‘Data as culture’, commissioning artists to respond to the increasing datification of society.
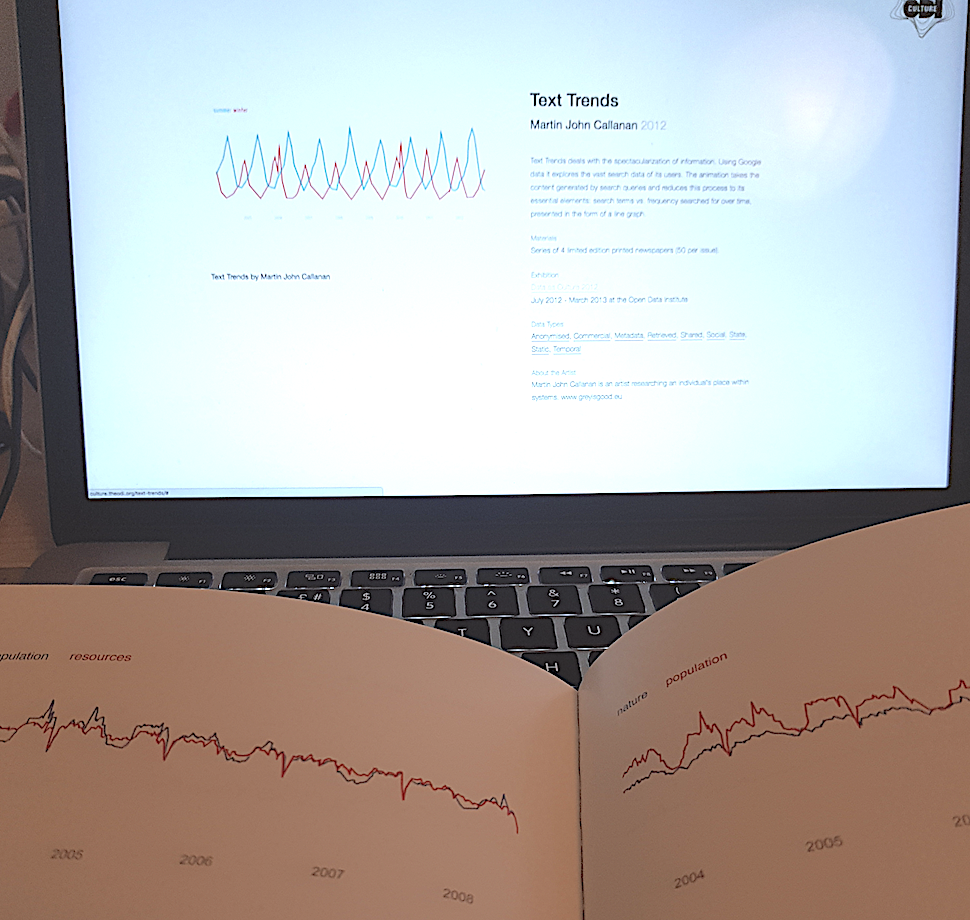
Some works take a relatively direct approach to representation, selecting particular streams of data from the web and using different media to represent them. Text trends, for example, selected and counterposes different google search trends on a simple graph over time. And the ODIs infamous vending machine provides free crisps in response to news media mentions of recession.
In representative works, the artist has chosen the signal to focus on, and the context in which it is presented. However, the underlying data remains more or less legible, and depending on the contextual media and the literacies of the ‘reader’, certain factual information can also be extracted from the artwork. Whilst it might be more time-consuming to read, the effort demanded by both the act of creation, and the act of reading, may invite a deeper engagement with the phenomena described by the data. London EC2 explores this idea of changing the message through changing the media: by woodblock printing twitter messages, thus slowing down the pace of social media, encouraging the viewer to rethink otherwise ephemeral information.
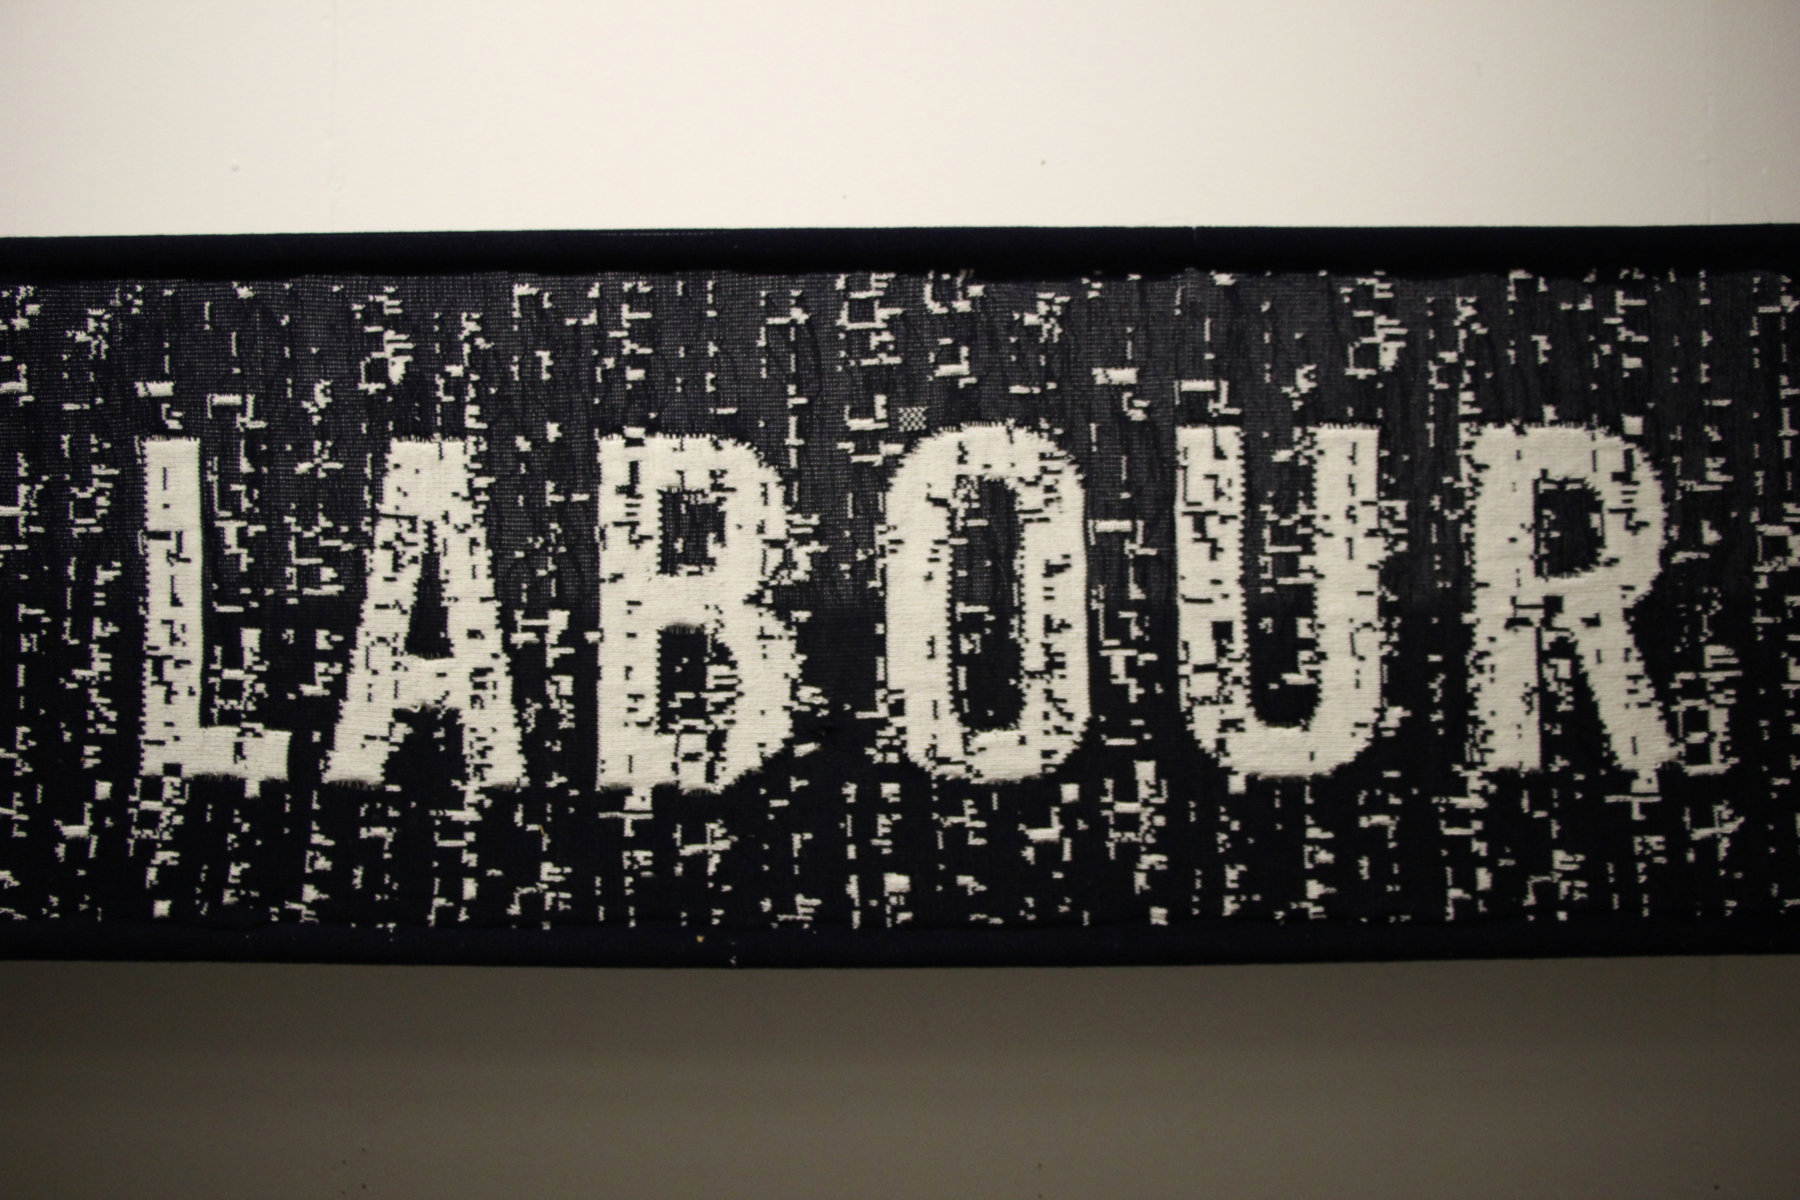
In other works that are directly driven by datasets, data is used more to convey an impression rather than to convey specific information. In the knitted Punchcard Economy banners, a representation working hours is combined with a pre-defined message resulting in data that can be read as texture, more than it can be read as pattern. In choosing how far to ‘arrange’ the data, the work finds its place on a spectrum between visualisation or aesthetic organisation.
Punchcard Economy, Sam Meech, 2013. ODI: 3.5 x 0.5m knitted banner, FutureEverything: 5 x 3m knitted banner & knitting machines.
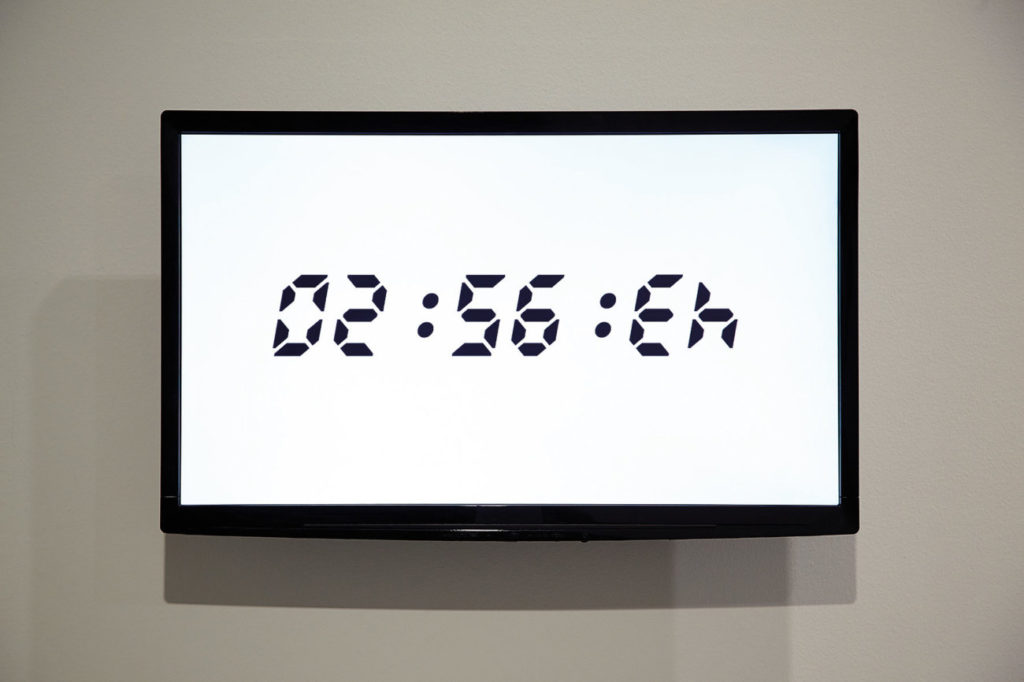
Other works in the data as culture collection start not from datasets, but from artists responses to wider trends of datification. Works such as metography, flipped clock and horizon respond to forms of data and it’s presentation in the modern world, raising questions about data and representation – but not necessarily about the specific data which happens to form part of the work.
Other works still, look for the data within art, such as pixelquipu which takes it’s structure from pre-Columbian quipu (necklace-shaped, knotted threads from the Inca empire, that are thought to contain information relating to calendars and accounting in the empire). In these cases, turning information into data, and then representing it back in other way, is used to explore patterns that might not have otherwise been visible.
YoHa: Invisible Airs
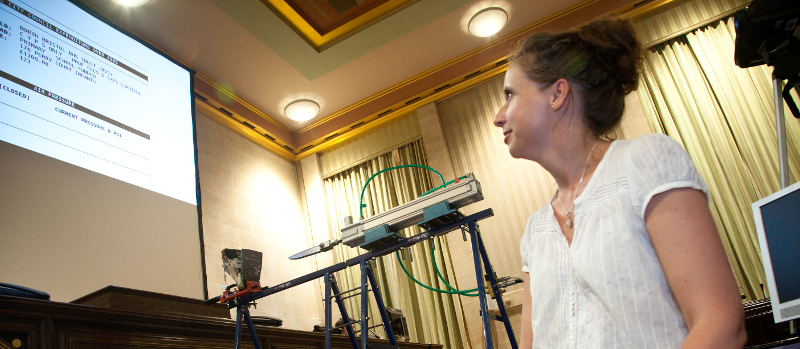
Although it has also featured in the ODI’s Data as Culture collection, I want to draw out and look specifically at YoHa’s ‘Invisible Airs’ project. Not least because it was the first real work of ‘open data art’ I encountered, stumbling across it at an event in Bristol.
As newly released public spending records appear on screen, a pneumatically powered knife stabs a library book, sending a message about budget cuts, and inviting scrutiny of the data on screen.
It is a hard project to describe, but fortunately YoHa have a detailed project description and video on their website, showing the contraptions (participatory kinetic sculptures?) they created in 2014, driven by pneumatic tubes and actuated by information from Bristol City Council’s database of public spending.
In the video, Graham Harwood describes how their different creations (from a bike seat that rises up in response to spending transactions, to a pneumatic knife stabbing a book to highlight library service cuts) seek to ‘de-normalise’ data, not in the database designers sense of finding a suitable level of data abstraction, but in the sense of engaging the participant to understand otherwise dry data in new ways. The learning from the project is also instructive: in terms of exploring how far the works kept the attention of those engaging with them, or how far they were able to communicate only a conceptual point, before viewers attention fell away, and messages from the underlying data were lost.
Ultimately though, Invisible Airs (and other YoHa works engaging with the theme of data) are not so much communicating data, as communicating again about the role, and power, of data in our society. Their work seeks to bring databases, rather than the individual data items they contain, into view. As project commissioner Prof Jon Dovey puts it, “If you are interested in the way that power works, if you are interested in the way that local government works, if you are interested in the way that corporations work, if you are interested in the way that the state works, then data is at the heart of it…. The way your council tax gets calculated… the way your education budget gets calculated, all these things function through databases.”
Everyday data arts
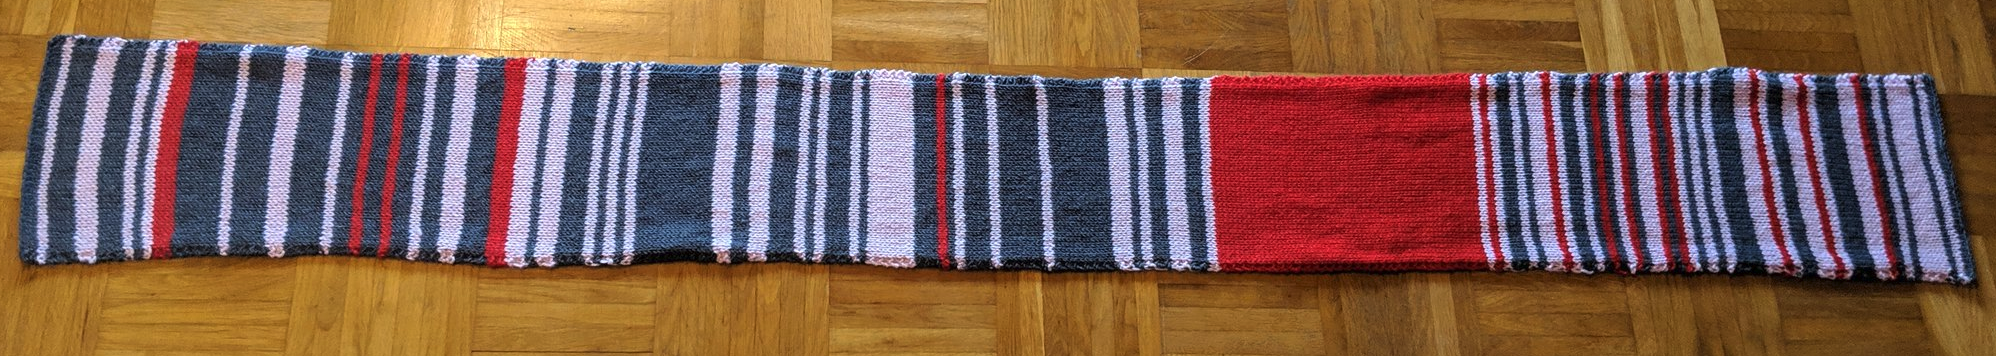
Data as art need not involve costly commissions. For example, the media recently picked up on the story of a german commuter who had knitted a ‘train-delay scarf’, with choice of wool and colour representing length of delays. The act of creating was both a means to record, and to communicate, and in the process communicate much more effectively than the same data might have done if simply recorded in a spreadsheet, or even placed onto a chart with data visualisation.
‘Train Delay Scarf’ – a twitter sensation in January 2019.
Data sculpture and data-driven music
In a 2011 TED Talk, Nathalie Miebach has explored both how weather data can be turned into a work of art through sculpture and music, as well as questioning how the setting in which the resulting work is show affects how it is perceived.
She describes the creation of a vocabulary for turning the data into a creative work, but also the choice of a media that is not entirely controlled by the data, such that the resulting work is not entirely determined by the data, but also by its interaction with other environmental factors.
Dance your PhD, and dancing data
When reflecting on data and art, I was reminded of the annual Dance your PhD competition. Although the focus is more on expressing algorithms and research findings, than underlying datasets, it offers a useful way to reflect on ways to explain data, not only express what it contains.
In a similar vein, AlgoRythmics explain sorting algorithms using folk dance – a playful way of explaining what’s going on inside the machine when processing data.
There is an interesting distinction though between these two. Whilst Dance your PhD entries generally ‘annotate’ the dance with text to explain the phenomena that the dance engages with audience with, in AlgoRythmics, the dance itself is the entirety of the explanation.
Visualisation
The fields of InfoViz and DataViz have exploded over the last decade. Blog such as InformationIsBeautiful,Flowing Data and Visualising Data provide a regular dose of new maps, charts and novel presentation of data. However, InfoViz and DataViz are not simply synonyms: they represent work that starts from different points of a Data/Information/Knowledge model, and with often different goals in mind.
Take, for example, David McCandless’ work in the ‘Information in Beautiful’ book (also presented in this TED Talk). The images, although often based on data, are not a direct visualisation of the data, but an editorialised story. The data has already been analysed to identify a message before it is presented through charts, maps and diagrams.
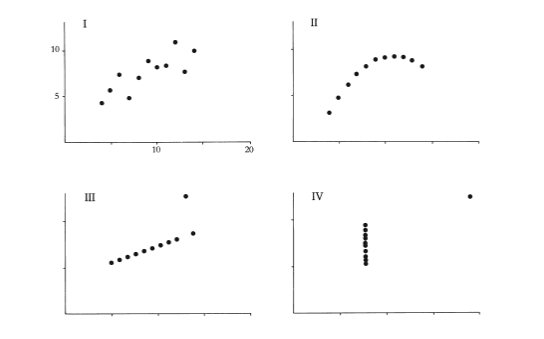
By contrast, in Edward Tufte’s work on data visualisation, or even statistical graphics, the role of visualisation is to present data in order to support the analytical process and the discovery of information. Tufte talks of ‘the thinking eye’, highlighting the way in which patterns that may be invisible when data is presented numerically, can become visible and intelligible when the right visual representation is chosen. However, for Tufte, the idea of the correct approach to visualisation is important: presenting data effectively is both an art and a technical skill, informed by insights and research from art and design, but fundamentally something that can be done right, or done wrong.
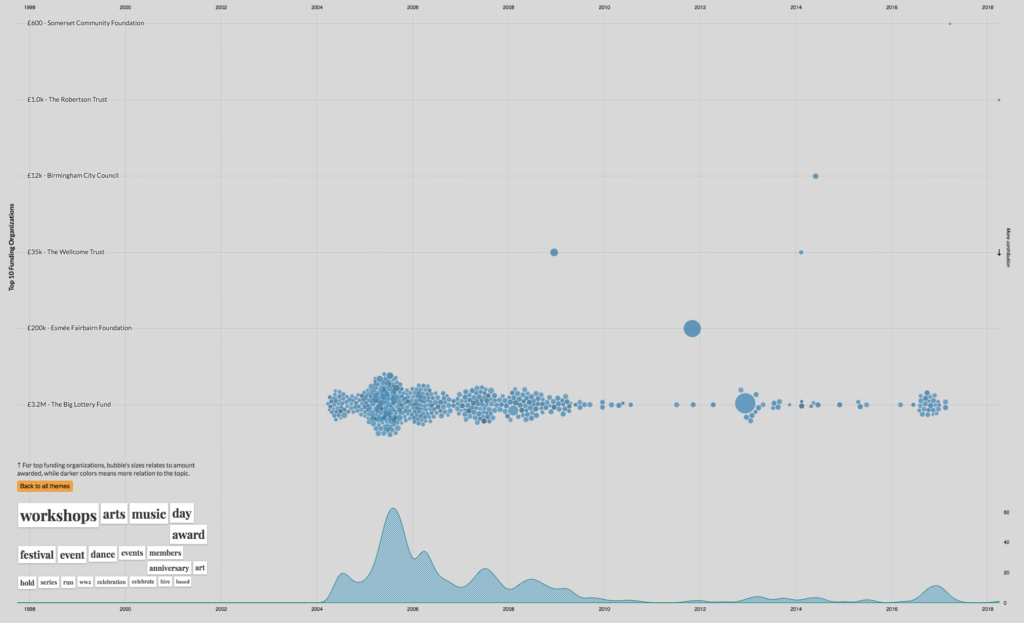
Other data visualisation falls somewhere between the extremes I’ve painted here. Exploratory data visualisations can seek to both support analysis, but also to tell a particular story through their selection of visualisation approach. A look at the winners of the recent 360 Giving Data Visualisation Challenge illustrates this well. Each of these visualisation draws on the same open dataset about grant making, but where ‘A drop in the bucket’ uses a playful animation to highlight the size of grants from different funders, Funding Themes extracts topics from the data and presents an interactive visualisation, inviting users to ‘drill down’ into the data and explore it in more depth. Others, like trend engine use more of a dashboard approach to present data, allowing the user to skim through and find, if not complete answers, at least refined questions that they may want to ask of the raw dataset.
Funding Trends for a ‘cluster’ of arts-related grants, drawing on 360 Giving data. Creator: Xavi Gimenez
Arts meet data | Data meet arts | Brokering introductions
Writing this post has given me a starting point to explore some data-art-dichotomies and to survey and link to a range of shared examples that might be useful for conversations in the coming weeks.
It’s also sparked some ideas for workshop methods we might be able to use to keep analytical, interpretative and communicative modes in mind when planning for a hackathon later this year. But that will have to wait for a future post…
Footnotes
[1]: I am overstating the argument in the blog post on art and data visualisation slightly for effect. The post, and comments in fact offer a nuanced dialogue worth exploring on the relationship of data visualisation and art, although still seeking to draw a clear disjunct relationship.
[Summary: I promise at some point this blog will carry content other than about incinerators and contracts. But, for the moment one more exciting instalment in the ongoing saga, in which we learn the contracting documents GCC have been fighting to hide show a 30% increase in Javelin Park costs.]
What’s just happened
Gloucestershire County Council (GCC) decided earlier this week to drop their appeal against an ICO ruling that they should release in full a 2015 ‘Value for Money’ analysis carried out just before they signed a revised contact with Urbaser Balfour Beatty (UBB) for building the Javelin Park Incinerator (which we’ve been referring to locally as the Ernst and Young report).
Throughout the process GCC have claimed that ‘commercial’ risk to both the Council and UBB prevents them from disclosing the documents. By dropping the appeal just a month before it was due to go to a Tribunal hearing, they avoid having to prove any of these claims in front of a panel and judge.
In addition, GCC appear to have delayed providing this information in order to commission Ernst and Young to produce another report, this time calculating an assumption-laden average gate fee, in order to continue to make the case for the project. This is at odds with the requirements of the Environmental Information Regulations to prompt disclosure – as presumably GCC must have known the commercial interest were no longer active prior to commissioning this new report, but instead chose to delay disclosure and spend taxpayers money on an ‘explanatory note’.
Where are we now
There’s a lot of history to this story, so to recap quickly.
Gloucestershire County Council have been seeking to build an Energy from Waste Incinerator for over a decade. In 2013 they signed a Public Private Partnership contract with UBB for the project. The contract was signed before planning permission was in place for the construction site. Planning was refused, leading to a two-year delay. This triggered a renegotiation of the contract in 2015, signed in January 2016. The plant is now under construction and close to being operational in 2019. Throughout the process GCC have claimed the project provides savings of up to £150m (later quietly reduced to £100m without explanation) over it’s 25 year life span.
Campaigners have long sought to see the contract, and in early 2016, the Information Rights Tribunal ruled that the majority of details, including gate fees (i.e. the price paid to burn waste) should be disclosed. I then requested a 2015 analysis relating to the re-negotiation, and was only given a highly redacted copy, not showing gate fees. I requested a review, and eventually appealed to the Information Commissioners Office (ICO) against authority refusal to release the information. The ICO ruled that the documents should be disclosed un-redacted. GCC appealed this decision in the summer, and since then have been preparing for a tribunal case claiming that disclosure would be against the contractors and the authorities commercial interest. They have now released the documents, although notably only claiming the contractor no longer has a commercial interest in them being confidential, leaving lingering questions about whether the authority had any legitimate commercial interest in non-disclosure all along.
What do we learn from the new documents
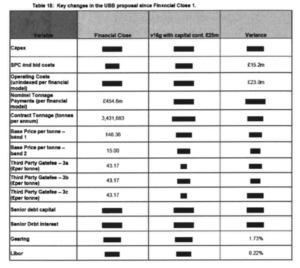
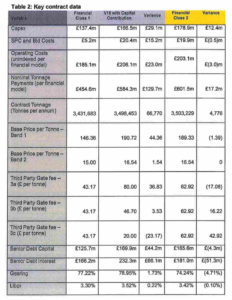
First below is the redacted document from GCC (click for full size). Then there is the equivalent table from the un-redacted and new report by Ernst and Young (which usefully does include the final rather than forecast figures for the renegotiated deal: i.e. the actual new contract numbers assuming there has been no further renegotiation since).
(Note that in the Table 2, the first ‘Variance’ column is between the originally signed contract, and the forecast revisions in 2015, and the second Variance column (in yellow) is between the forecast revisions, and the finally signed updated deal. So to get total variation from 2013 to 2016, you need to add these two columns together.)
So: what can we learn from the new data and documents:
(1) Firstly, the headline price per-tonne has increased by £42.97/tonne – a staggering 29.3% rise for a three year project delay (cumulative CPI inflation over the same period was 5.13%). The total per-tonne cost for the first 108,000 tonnes is now £189.33/tonne: far above anything any other authority in the country appears to be paying.
(2) This drives an increase in the nominal tonnage payments over the contract life of £446m to £601.5m. Whilst some of that might be offset by energy income/benefits, given these were also part of the case in 2013, this looks like a massive increase in costs – again just for a three year delay. (Given predicted waste volume rises in all the forecasts the contract is based on, a three year delay also involves starting the project when waste volumes are higher than in 2013 – so some change would be anticipated in this figure even if there was no gate fee increases. But the gate fee increases look like the major component turning Javelin Park from a £450m to a £600m project).
(3) Other tonnage payments have also increased – although the most notable change between the forecast, and signed renegotiation is that ‘Third Party Gate Fees’ have been kept down – suggesting that the financial modelling for the plant relies on attracting as much additional waste as possible at a low cost, with all the fixed costs of the project subsidised by the taxpayer.
(4) The Cabinet were told in November 2015 (E&Y VfM report; §3.1) that the capital costs of the project in UBB’s original Revised Project Plan “included a significantly inflated price of £177m.” but that “The council has had some success in negotiating this EPC price down and it now stands at £167m” and “the Council expects to see further improvements in this price”, yet by the signature of the new deal, the capital expenditure costs were also up 30% £178.9m – £2m higher than UBB’s opening gambit!
(5) The Value for Money calculations (E&Y VfM report, and restated in Table 3, new E&Y report) only carry out comparisons to ‘Termination (Landfill alternative)’ of which at least £60m is the cancellation cost signed up to in 2013. For this reason, the newly released Annex 1 of the report to Cabinet in 2015 (§6) explicitly acknowledges that the most that should be claimed in savings when this is taken out is £93m – and this is only when Council reserves are put into the project. It’s not clear why Cabinet Members continued to use a figure higher than this in public after this report.
(6) The first important thing from that last point are that at no point in 2015, did the Cabinet carry out a Value for Money assessment comparing the costs of continuing with the 30% more expensive contract, vs. cancelling and re-tendering. Instead, they pressed ahead with a closed-door renegotiation without competitive pressures – which goes a long way to explaining why the contractor could get such a big boost in costs.
(7) The second thing to note is that the claim of anything close to £100m savings is only secured by the cash injection into the project from reserves. Those are reserves that are then locked up and not available for other use. Without cash injections from reserves, the savings are much lower.
The mystery of the ‘Real Average Gate Fee’
In the new Ernst and Young report that accompanies the response to my EIR/FOI request, a lot is made of a figure called the ‘Real Average Gate Fee’ (RAGF), which is calculated at £112.47/tonne.
Now – a few things about this number:
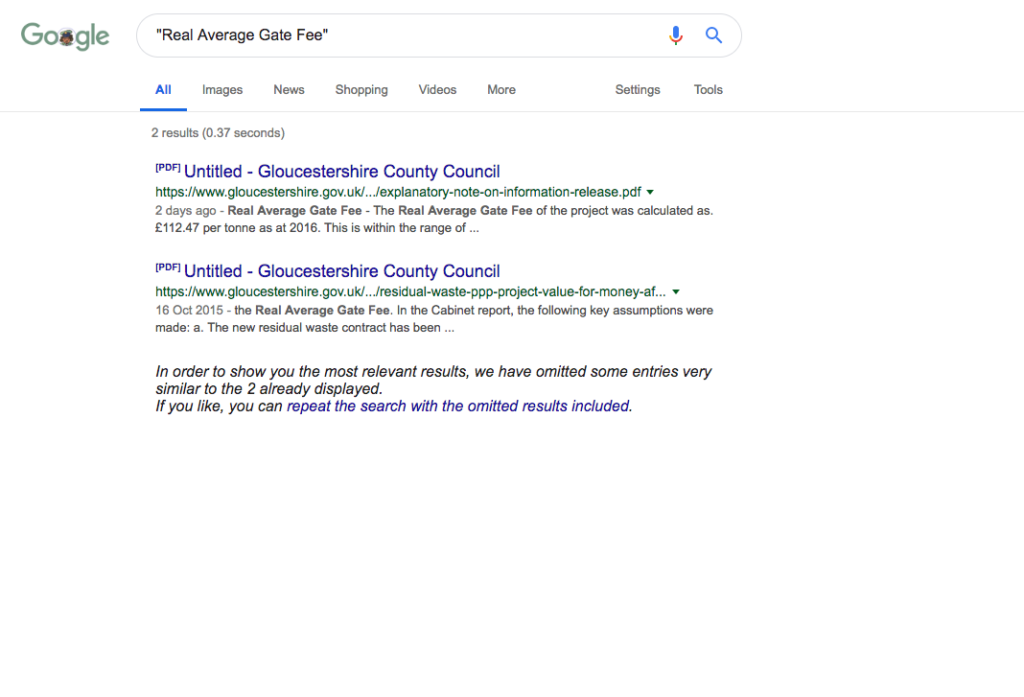
(1) I googled “Real Average Gate Fee” to see if this was based on an established industry wide methodology. As it turns out – the only place this phrase occurs on the whole of the Internet is in Ernst and Young’s report.
It turns out no-one apart from GCC know what a Real Average Gate Fee is either
(2) As I understand, this number is based on making best case assumptions about the income to the authority from electricity sales, and third-party income – and assuming the maximum contract tonnages set out in authority forecasts. If those assumptions are not met (e.g. we hit 60% recycling by 2020 and 70% by 2029/30; or waste volumes do not continue to rise as fast as forecast), then, because of the structure of the contract (all front-loaded costs on the first 108,000 tonnes; savings on waste volumes above this), the RAGF would very quickly rise. In other words, the RAGF is only valid if you accept high waste assumptions. In any other scenario it gets much higher.
(3) The report compares this to the range of real gate fees that WRAP found in their 2016 survey. Note that WRAP have a pretty robust methodology in their survey, and they state:
“Not all waste management services are costed or charged on a simple gate fee basis (£/tonne). In some cases a tonnage-related payment is just one element of a wider unitary charge paid by an authority” and that “every effort is made to eliminate such responses from the sample”
so the comparison of a constructed ‘Real Average Gate Fee’ from a unitary charge/PPP structure to a real gate fee is questionable at best.
(4) However, even more questionable is picking the 2016 data to compare the RAGF too. We now have 2017 data available from WRAP, and the E&Y report notes that this figure is based on the ‘Net Present Value based date of June 2015‘, so both 2015 and 2017 would seem more reasonable years to compare too.
Pro-tip: When looking to manipulate figures, always pick your comparison year to make your numbers look the best you can…
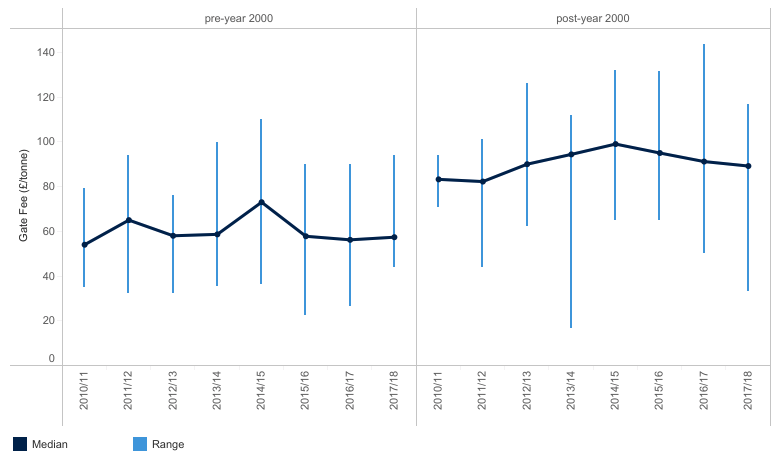
A quick look at WRAP’s EfW Overview dashboard for post-2000 plants gives us a clue as to why this year was chosen. 2016 is an outlier when it comes to maximum values in WRAPs survey. In 2015, the highest anyone responding to the survey was paying per tonne was £131/tonne, and in 2017 it was £116/tonne.
Even if we allow the not-really-comparable RAGF of £112/tonne – that put it right at the top of the range. Even a small reducting in income from energy, or reductions in waste, would push this into being the most expensive deal in the country.
If you compare the actual gate fee of £190/tonne for the first 108.000 tonnes, it is clear this is massively above what anyone else surveyed is paying.
What we still need to explore
The Ernst and Young Report VfM report notes that the overall lifetime project costs could have been substantially reduced with ‘Prudential Borrowing’ (i.e. relying on low interest loans the authority can achieve, rather than private banks). Annexe 1 to the 2015 Cabinet Report reveals this option was ignored, because it would have required discussion as part of the Council’s budget process in February 2016 and it states “the banks have advised that they need to achieve financial close by the end of the year [2015]”.
However, financial close was not achieved until January 2016 (it seems the banks didn’t mind so much after all?). It’s not yet clear to me what information Councillors outside cabinet had at the time on this decision – and what it tells us about the pursuit of a PFI option, when it appears other, much cheaper public funded options for the project were available.
There is also a question of the missing OJEU (Official Journal of the European Union) notice. It seems that, whilst in most cases, any contract variation of over 10% in value after the Public Contract Regulations 2015 came into force should normally have involved re-tendering, an exception may have been permissable for this project because of ‘unforseen circumstances’ (although whether the planning refusal is something a dilligent authority could not have forseen is open to major question). Notwithstanding that – LGA guidance states that in a case of major contract modification “a special type of notice must be published in OJEU” a “‘Notice of modification of a contract during its term’.”
I’ve not been able to find any evidence that such a notice was issued, and Cllr Rachel Smith has also asked for copies of all OJEU notices related to the project a number of times, and a contract modification notice has never been amongst them.
Where next?
Hopefully a Christmas break! Whilst it was kind of GCC to drop these documents just before Christmas – I’m hoping to have at least a bit of time off.
However, far from proving the value for money or transparency of the project as Councillors claim: these documents show there are still major questions to be answered about how a secret renegotiation led to 30% increase in costs, and why no assessments took place to look at non-landfill alternatives and create at least some sort of competitive pressure at the time of renegotiation.
There are also major questions to be asked about the handing of the Information Tribunal appeal. But those can wait for a day or two at least.
 The online and open access book versions ‘The State of Open Data: Histories and Horizons’ went live yesterday. Do check it out!
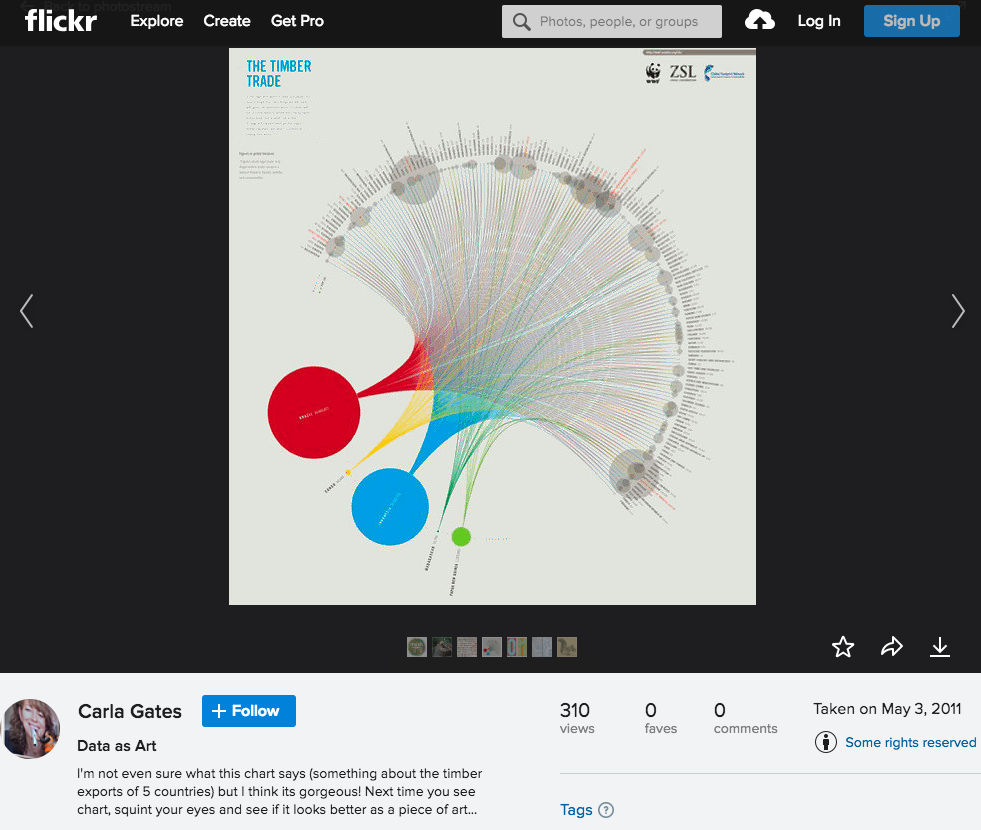


