Over the last week I’ve been sharing a short series of articles exploring the past, present and future of (open) data portals. This comes as part of a piece of work I’m doing for the Open Data Institute on ‘Data Platforms and Citizen Engagement’.
The work starts from the premise that data portals have been an integral part of the open data movement. Indeed, for many (myself included) the open data movement was crystallised with, or first discovered through, the launch of platforms like Data.gov and Data.gov.uk. However, we are going on to ask whether, a decade on, portals still have a role to play? And if so, what might that role most usefully be? Ultimately, we’re asking if, and if so, how, portals might be (re-)shaped as effective platforms to support ongoing ambitions for open data to support meaningful citizen participation in all its forms.
Over the course of a short rapid research sprint I’ve been pulling at a couple of threads that might contribute to that inquiry. The goal has been to carry out some groundwork to support the next stage of the project: which we are hoping will take the form of some sort of design excercises, accompanied by a number of deeper conversations and possibly further research. I overshot my initial plan of spending five days ‘catching up’ with what’s been happening in the portal landscape since I last looked, not least because the simple answer is – a lot’s been happening. And, at the same time, if you compare a portal from 2012 with the same one today, the answer to the question ‘What’s changed?’ often also seems to be, not very much. The breadth and depth of work constructing and critiquing portals across the world is both impressive, and oppressive. It seems that, collectively, we know there are problems with portals, but, there is much less consensus on the way forward.
Each post in this series has tried to look at ‘the portals problem’ from one specific perspective, aiming to provide some shared context that might assist in future conversations. The posts are all over on PubPub, where they’re open to comment (free sign-up needed):
If, after exploring some of these, you think you might be interested in joining some of the open design sprint work we’re planning for next year to build on this exploration – and on parallel strands of research that have been taking place (likely involving some online or in-person full and half-day sessions in early Feb) do drop me a line via twitter or (for this project only) my ODI e-mail address: tim.davies@theodi.org and I can share more info as plans firm up.
I’m cross-posting this from a deep-dive series of working drafts I’ve been developing for The Open Data Institute, providing ground work for exploring potential future developments that could support data portals and platforms to function better as tools of civic participation. It provides a general history of the development of citizen participation, primarily in the UK context, that I hope may be of interest to a wide range of readers of this blog, as well as setting this in the context of data portals as participation tools (possibly more of a niche interest..). You can find the full series of posts which talk a lot more about data portals, here.
A key cause of data portal dissatisfaction is the apparent failure of portals to provide effective platforms for citizen participation in government and governance. The supposed promise of portals to act as participatory platforms can be read into the 2009 Obama Open Government Memo on transparent, participatory and collaborative government, and the launch of data.gov.uk amongst the hackathons and experiments with online engagement that surrounded the Power of Information report and taskforce. Popular portal maturity models have envisioned them evolving to become participatory platforms [1][2] and whilst some work has acknowledged that there are different forms of participatory engagement with the state, ranging from monitorial democracy, to the co-production of public services [3], the mechanisms by which portals can help drive participation, and the forms of participation in focus, have been frequently under-theorised.
In the current policy landscape, there is a renewed interest in some forms of participatory engagement. Citizens assemblies, deliberative fora, and other forms of mini-public are being widely adopted as ways to find or legitimate ways forward on thorny and complex issues. Amidst concerns about public trust, democratic control, and embedded biases, there are calls for participatory processes to surround the design and deployment of algorithmic systems in particular [4], creating new pressure on participatory methods to engage effectively with data. However, public participation has a long history, and these latest trends represent just one facet of the kinds of processes and modes of engagement we need to have in mind when considering the role of data portals in supporting citizen engagement. In this short piece I want to briefly survey the history of public participation, and to identify potential insights for the development of data portals as a support for participatory processes. My focus here is primarily on the UK landscape, although I’ll try and draw upon wider global examples where relevant.
A short history of citizen participation
In the blog post ‘A brief history of participation’, historian Jo Guldi explores the roots of participatory governance ideas, tracing them as far back as the early mediaeval church, and articulating ideas of participatory governance as a reaction to the centralised bureaucracies of the modern nation state. Guldi points to the emergence of “a holistic political theory of self-rule applicable to urban planning and administration of everyday life” emerging in the 1960s, driven by mass youth movements, mass media, and new more inclusive notions of citizenship in an era of emerging civil rights. In essence, as the franchise, and education, expanded, default models of ‘elite governance’ came to be challenged by the idea that the public should have a greater voice in day to day decision making, if not greater direct ownership and control of public authority.
In Guldi’s global narrative, the emphasis of the 1970s and 80s was then on applying participatory ideas within the field of International Development, particularly participatory mapping – in which marginalised citizens are empowered to construct their own maps of territory: in a sense creating counter-data to secure land rights, and protect customary resources from logging or other incursions. Guldi points in particular to the role of institutions such as the World Bank in promoting participatory development practises, a theme also found in Leal’s ‘Participation: the ascendancy of a buzzword in the neo-liberal era’ [5]. Leal highlights how, although participatory methods have their roots in the emancipatory pedagogy of Paulo Friere and in Participatory Action Research, which aims at a transformation of individual capabilities alongside wider cultural, political and economic structures – the adoption of participation as a tool in development can act in practice as a tool of co-option: depoliticising critical decisions and offering participants only the option to modify, rather than fundamentally challenge, directions of development. Sherry Arnstein’s seminal ‘A ladder of citizen participation’ article[6], published in 1969 in an urban planning journal, has provided a reliable lens for asking whether participation in practice constitutes decoration, tokenism, or genuine citizen power.
Illustration of the ladder of participation from Arnstein’s original article, showing eight rungs, and three categories of participation, from ‘nonparticipation’, to ‘degrees of tokenism’ and up to ‘degrees of citizen power’.
In the UK, whilst radical participatory theory influenced grassroots community development work throughout the 1980s, it was with the election of the New Labour Government in 1997 that participation gained significant profile in mainstream policy-making: with major initiatives around devolution, the ‘duty to consult’, and an explosion of interest in participatory methods and initiatives. Fenwick and McMillan describe participation for New Labour as ‘something at the heart of the guiding philosophy of government’, framed in part as a reaction to the consumer-oriented marketised approach to public management of the Thatcher era. Yet, they also highlight a tension between an ideological commitment to participation, and a managerial approach to policy that sought to also ‘manage’ participation and its outcomes. Over this period, a particular emphasis was placed on participation in local governance, leading top-down participation agendas to meet with grassroots communities and community development practices that had been forged through, and often in opposition to, recent decades of Conservative rule. At its best, this connection of participatory skill with space to apply it provided space for more radical experiments with community power. At its worst, and increasingly over time, it led to co-option of independent community actors within state-directed participation: leading ultimately to a significant loss of both state-managed and community-driven participatory practice when the ‘era of austerity’ arrived in 2010.
The 2000s saw a proliferation of guides, handbooks and resources (e.g.) outlining different methods for citizen participation: from consultation, to participatory budgeting, citizens panels, appreciative inquiries, participatory research, and youth fora. Digital tools were initially seen broadly as another ‘method’ of participation, although over time understanding (albeit still relatively limited) has developed of how to integrate digital platforms as part of wider participatory processes – and as digital development has become more central in policy making, user-involvement methodologies from software development have to be critically considered as part of the citizen participation toolbox. Concepts of co-production, co-design and user-involvement in service design have also increasingly provided a link-point between trends in digital development and citizen participation.
Looking at the citizen participation landscape in 2021, two related models appear to be particularly prominent: deliberative dialogues, and citizens assemblies. Both are predicated on bringing together broadly representative groups of citizens, and providing them with ‘expert input’, generally through workshop-based processes, and encouraging deliberation to inform policy, or to generate recommendations from an assembly. Notably, deliberative methods have been adopted particularly in relation to science and technology, seen as a way to secure public trust in emerging scientific or technological practice, including data sharing, AI and use of algorithmic systems. Whilst deliberative workshops and citizens assemblies are by no means the only participatory methods in use in 2021, they are notable for their reliance on expert input: although the extent to which direct access to data features in any of these processes is perhaps a topic for further research.
By right, or by results
Before I turn to look specifically at the intersection of data and participation, it is useful to briefly remark on two distinct lines of argument for participation: values or rights-based, vs. results based.
The rights-based approach can be found both in theories of participatory democracy that argue democratic mandate is not passed periodically from voters to representatives, but is constantly renewed through participatory activities engaging broad groups of citizens, and in human-rights frameworks, including notably the UN Convention on the Rights of the Child (UNCRC), which establishes children’s rights to appropriate participation in all decisions that affect them. Guidance on realising participation rights adopted in 2018 by the UN Human Rights Council explicitly makes a link with access to information rights, including proactive disclosure of information, efforts to make this accessible to marginalised groups, and independent oversight mechanisms.
A results-based approach to citizen participation is based on the idea that citizen engagement leads to better outcomes: including supporting more efficient and effective delivery of public services, securing greater citizen trust in the decisions that are made, or reducing the likelihood of decisions being challenged. Whilst some user and human-centred design methodologies may make reference to rights-based justifications for inclusion of often marginalised stakeholders, in general, these approaches are rooted more in a result-based than a rights-based framework: in short, many firms and government agencies have discovered projects have greater chance of success when you adopt consultative and participatory design approaches.
Participation, technology and data
Although there have been experiments with online participation since the earliest days of computer mediated communication, the rise of Web 2.0 brought with it substantial new interest in online platforms as tools of citizen engagement: both enabling insights to be gathered from existing online social spaces and digital traces, and supporting more emergent, ad-hoc or streamlined modes of co-creation, co-production, or simply communication with the state (as, for example, in MySociety’s online tools to write to public representatives, or report street scene issues in need of repair). There was also a shift to cast the private sector as a third stakeholder group within participatory processes – primarily framed as originator of ideas, but also potentially as the target of participation-derived messages. As the Open Government Partnership’s declaration puts it, states would “commit to creating mechanisms to enable greater collaboration between governments and civil society organizations and businesses.”
With rising interest in open data, a number of new modes and theories of participation came to the fore: the hackathon [7][8][9], the idea of the armchair auditor [10], and the idea of ‘government as a platform’ [11][12] each invoke particular visions of citizen-state and private-sector engagement.
A focus in some areas of government on bringing in greater service-design approaches, and rhetoric, if not realities, of data-driven decision making have also created new spaces for particular forms of participatory process, albeit state-initiated, rather than citizen created. And recent discussions around data portals and citizen participation have often centred on the question of how to get citizens to engage more with data, rather than how data can support existing or potential topic-focussed public participation.
In my 2010 MSc thesis on ‘Open Data, Democracy & Public Sector reform: open government data use from data.gov.uk’ I developed an initial typology of civic Open Government Data uses, based on a distinction between formal political participation (representative democracy), collaborative/community based participation (i.e. participatory democracy or utility-based engagement), and market participation (i.e. citizen as consumer). In this model, the role data plays, and the mechanisms it works through, vary substantially: from data being used through media to inform citizen scrutiny of government, and ultimately discipline political action through voting; to data enabling citizens to collaborate in service design, or independent problem solving beyond the state; and to the consumer-citizen driving change through better informed choices of access to public services. In other words, greater access to data theoretically enables a host of different genres of participation (albeit there’s a normative question over how meaningful or equitable each of these different forms of participation are) – and many of these do not rely on the state hosting or convening the participation process.
What is notable about each of these ‘mechanisms of change’ is that data accessed from a portal is just one component of a wider process: be that the electoral process in its entirety, a co-design initiative at the community level, or some national market-mechanism supported by intermediaries translating ‘raw data’ into more accessible information that can drive decisions over which hospital to use, or which school to choose for a child. However, whilst many participatory initiatives have suffered in an era of austerity, and enthusiasm for the web as an open agora for public debate has waned in light of a more hostile social media environment, portals have persisted as a primary expression of the ‘open government’ era: leaving considerable pressure placed upon the portal to deliver not only transparency, but also participation and collaboration too.
Citizen participation and data portals
What can we take from this brief survey of citizen participation when it comes to thinking about the role of data portals?
Firstly, the idea that portals as technical platforms can meaningfully ‘host’ participation in its entirety appears more or less a dead-end. Participation takes many varied forms, and whilst portals might be designed (and organisationally supported) in ways that position them as part of participatory democracy, they should not be the destination.
Secondly, different methods of citizen participation have different needs. Some require access to simple granular ‘facts’ to equalise the balance of power between citizen and state. Others look for access to data that can support deep research to understand problems, or experimental prototyping to develop solutions. Whilst in the former case, quick search and discovery of individual data-points is likely to be the priority, in these latter cases, greater understanding of the context of a dataset is likely to be particularly valuable, as would, in many cases, the ability to be in contact with a datasets’ steward.
Third, the current deliberative wave appears as likely to have data as its subject (or at least, the use of data in AI, algorithmic systems or other policy tools), as it is to use open data as an input to deliberation. This raises interesting possibilities for portals to surface and support great deliberation around how data is collected and used, as a precursor to supporting more effective use of that data to drive policy making.
Fourth, citizen participation has rarely been a ‘mass’ phenomena. Various research suggest that at any time less than 10% of the population are engaged in any meaningful form of civic participation, and only a percentage of these are likely to be involved in forms of engagement that are particularly likely to benefit from data. Portals should not carry the burden of solving a participation deficit, but there may be avenues to design them such that they connect with a wider group of active citizens than their current data-focussed constituency.
Fifth, and finally, citizen participation is not invented with the portal – and we need to be conscious of both the long history, and contested conceptualisations, of citizen participation. The government portal that seeks to add participatory features is unlikely to be able to escape the charge that it is seeking to ‘manage’ participation processes: although independently created or curated portals may be able to align with more bottom-up community participation action and operate within a more emancipatory, Frierian notion. Both data, and participation, are, after all, about power. And given power is generally always contested, the configuration of portals as a participatory tool may be similarly so.
Citations
Alexopoulos, C., Diamantopoulou, V., & Charalabidis, Y. (2017). Tracking the Evolution of OGD Portals: A Maturity Model. In Lecture Notes in Computer Science (pp. 287–300). Springer International Publishing. https://doi.org/10.1007/978-3-319-64677-0_24
Zhu, X., & Freeman, M. A. (2018). An evaluation of U.S. municipal open data portals: A user interaction framework. Journal of the Association for Information Science and Technology, 70(1), 27–37. https://doi.org/10.1002/asi.24081
Ruijer, E., Grimmelikhuijsen, S., & Meijer, A. (2017). Open data for democracy: Developing a theoretical framework for open data use. Government Information Quarterly, 34(1), 45–52. https://doi.org/10.1016/j.giq.2017.01.001
Wilson, C. (2021). Public engagement and AI: A values analysis of national strategies. Government Information Quarterly, 101652. https://doi.org/10.1016/j.giq.2021.101652
Sieber, R. E., & Johnson, P. A. (2015). Civic open data at a crossroads: Dominant models and current challenges. Government Information Quarterly, 32(3), 308–315. https://doi.org/10.1016/j.giq.2015.05.003
Perng, S.-Y. (2019). Hackathons and the Practices and Possibilities of Participation. In The Right to the Smart City (pp. 135–149). Emerald Publishing Limited. https://doi.org/10.1108/978-1-78769-139-120191010
O’Leary, D. E. (2015). Armchair Auditors: Crowdsourcing Analysis of Government Expenditures. Journal of Emerging Technologies in Accounting, 12(1), 71–91. https://doi.org/10.2308/jeta-51225
The OECD digital government policy framework. (2020, October 7). OECD Public Governance Policy Papers. Organisation for Economic Co-Operation and Development (OECD). https://doi.org/10.1787/f64fed2a-en
[Summary: Reflections on the design of ITU Data Pledge project]
The ITU, under their “Global Initiative on AI and Data Commons” have launched a process to create a ‘Data Pledge’, designed as a mechanism to facilitate increased data sharing in order to support “response to humanity’s greatest challenges” and to ”help support and make available data as a common global resource.”.
Described as complementary to existing work such as the International Open Data Charter, the Pledge is framed as a tool to ‘collectively make data available when it matters’, with early scoping work discussing the idea of conditional pledges linked to ‘trigger events’, such that an organisation might promise to make information available specifically in a disaster context, such as the current COVID-19 Pandemic. Full development of the Pledge is taking place through a set of open working groups.
This post briefly explores some of the ways in which a Data Pledge could function, and considers some of the implications of different design approaches.
[Context: I’ve participated in one working group call around the data pledge project in my role as Project Director of the Global Data Barometer, and this is written up in a spirit of open collaboration. I have no formal role in the data pledge project..]
Governments, civil society or private sector
Should a pledge be tailored specifically to one sector? Frameworks for governments to open data are already reasonably well developed, as our mechanisms that could be used for governments to collaborate on improving standards and practices of data sharing.
However, in the private sector (and to some extent, in Civil Society), approaches to data sharing for the public good (whether as data philanthropy, or participation in data collaboratives are much less developed – and are likely the place in which a new initiative could have the greatest impact.
Individual or collective action problems
PledgeBank, a MySociety project that ran from 2005 to 2015, explored the idea of pledging as a solution to collective action problems. Pledges of the form: “I’ll do something, if a certain number of people will help me” are now familiar in some senses through crowdfunding sites and other online spaces. A Data Pledge could be modelled on the same logic – focussing on addressing those collective action problems either where:
A single firm doesn’t want to share certain data because doing so, when no-one else is, might have competitive impacts: but if a certain share of the market are sharing this data, it no longer has competitive significance, and instead it’s public good value can be realised.
The value of certain data is only realised as a result of network effects, when multiple firms are sharing similar and standardised data – but the effort of standardising and sharing data is non-negligible. In these cases, a firm might want to know that there is going to be a Social Return on Investment before putting resources into sharing the data.
However, this does introduce some complexity into the idea of pledging (and the actions pledged) and might, as PledgeBank found, lead also to lots of unrealised potential.
Pledging can also be approached as a means of solving individual motivational problems: helping firms to overcome inertia that means they are not sharing data which could have social value. Here, a pledge is more about making a statement of intent, which garners positive attention, and which commits the firm to a course of action that should eventually result in shared data.
Both forms of pledging can function as useful signalling – highlighting data that might be available in future, and priming potential ecosystems of intermediaries and users.
An organisational or dataset-specific pledge
Should a Pledge be about a general principle of data sharing for social good? Or about sharing a specific dataset? It may be useful to think about the architecture of the Data Pledge involving both: or at least, optionally involving data-specific pledges, under a general pledge to support data sharing for social good.
Think about organisational dynamics. Individual teams in a large organisation may have lots of data they could safely and appropriately share more widely for social good uses, but they do not feel empowered to even start thinking about this. A high-level organisational pledge (e.g. “We commit to share data for social good whenever we can do so in ways that do not undermine privacy or commercial position”) that sets an intention of a firm to support data philanthropy, participate in data collaboratives, and provide non-competitive data as open data, could provide the backing that teams across the organisation need to take steps in that direction.
At the same time, there may be certain significant datasets and data sources that can only be shared with significant high-level leadership from the organisation, or where signalling the specific data that might be released, or purposes it might be released for, can help address the collective action issues noted above. For these, dataset specific pledging (e.g. “We commit to share this specific dataset for the social good in circumstance X ”) can have significant value.
Triggers as required or optional
Should a pledge be structured to place emphasis on ‘trigger conditions’ for data sharing? Some articulations of the Data Pledge appear to think of it as a bank of data that could be shared in particular crisis situations. E.g. “We’ll share detailed supply chain information for affected areas if there is a disaster situation.”.There are certainly datasets of value that might not be listed as a Pledge unless trigger conditions can be described, but it’s important that the design of a pledge does not present triggers as essentially shifting any of the work on data sharing to some future point. Preparing for data to be used well and responsibly in a crisis situation requires work in advance of the trigger events: aligning datasets, identifying how they might be used, and accounting carefully for possible unintended consequences that need to be mitigated against.
There are also many global crisis we face that are present and ongoing: the climate crisis, migration, and our collective failure to be on track against the Sustainable Development Goals.
Brokering and curating
Data is always about something, and different datasets exist within (and across) different data communities and cultures. To operationalise a pledge will involve linking actors pledging to share data into relevant data communities: where they can understand user needs in more depth, and be able to publish with purpose.
The architecture of a Data Pledge, and of any supporting initiative around it, will need to consider how to curate and connect the many organisations that might engage – building thematic conversations, spotting thematic spaces where a critical mass of pledges might unlock new social value, or identifying areas where there are barriers stopping pledges turning into data flows.
Incorporating context, consent and responsible data principles
Increased data sharing is not an unalloyed good. Approaching data for the public good involves balancing openness and sharing, with robust principles and practices of data protection and ethics, including attention to data minimisation, individual rights, group data privacy, indigenous data sovereignty and dataset bias. Data should also be shared with clear documentation of it’s context, allowing an understanding of its affordances and limitations, and supporting debate over how data ecosystems can be improved in service of social justice.
A Pledge has an opportunity to both set the bar for responsible data practice, and to incentivise organisational thinking about these issues, by including terms that require pledging organisations to uphold high standards of data protection, only sharing personal data with clear informed consent or personal-derived data after clear processes that consider privacy, human rights and bias impacts of data sharing. Similarly, organisations could be asked to commit to putting their data in context when it is shared, and to engaging collaboratives with data users.
There may also be principles to incorporate here about transparency of data sharing arrangements – supporting development of norms about publishing clearly (a) who data is shared with and for what purpose; and (b) the privacy impact assessments carried out in advance of such shares.
Conditional on capacity?
Should pledging organisations be able to signal that they would need resources in order to make certain data available? I.e. We have Dataset X which has a certain social value: but we can’t afford to make this available with our internal resources? For low-resource organisations, including SMEs or organisations operating in low income economies, this could be a way to signal to philanthropic projects like data.org a need for support. But it could also be used by higher-resource organisations to put a barrier in front of data sharing. However, if a Pledge targets civil society pledgees, then allowing some way to indicate capacity needs if data is to be shared is likely to be particularly important.
A synthesis sketch
Whilst ideologically, I’d favour a focus on building and governing data commons, more directly addressing the modern ‘enclosure’ of data by private firms, and not forgetting the importance of proper taxation of data-related businesses to finance provision of public goods, if it’s viable to treat a data pledge as a pragmatic tool to increase availability for data for social good uses, then I’d sketch the following structure:
Target private sector organisations
A three part pledge
1. A general organisational commitment to treat data as a resource for the public good;
2. A linked organisational commitment to responsible data practices whenever sharing data;
3. An optional set of dataset specific pledges, each with optional trigger conditions
A platform allowing pledging organisations to profile their pledges, detail contact points for specific datasets and contact points for organisation-wide data stewards, and to connect with potential data users;
A programme of work to identify pre-work needed to allow data to be effectively used if trigger conditions are met ;
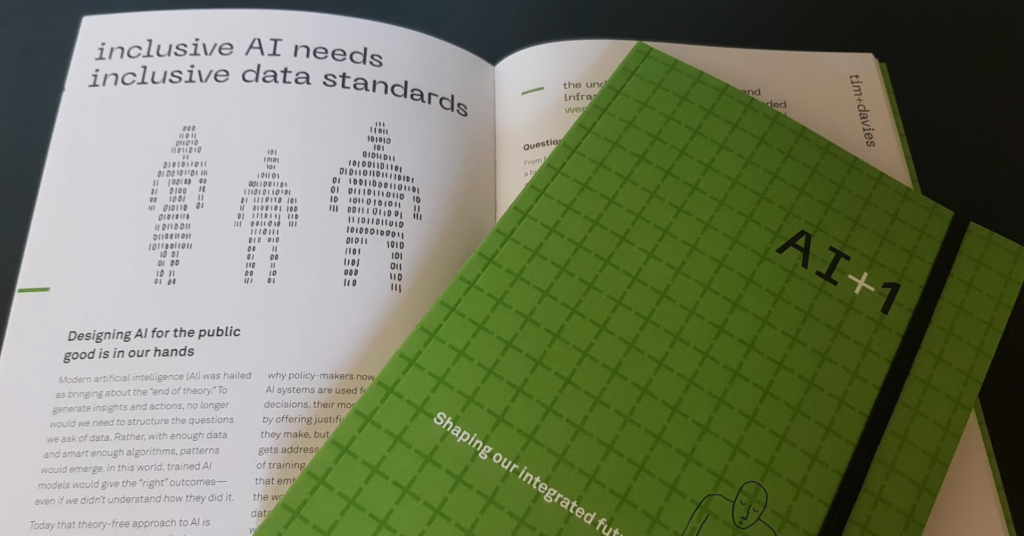
[Summary: following the Bellagio Center thematic month on AI last year, I was asked to write up some brief notes on where data standards fit into contemporary debates on AI governance. The below article has just been published in the Rockefeller ‘notebook’ AI+1: Shaping our Integrated Future*]
Modern AI was hailed as bringing about ‘the end of theory’. To generate insight and action no longer would we need to structure the questions we ask of data. Rather, with enough data, and smart enough algorithms, patterns would emerge. In this world trained AI models would give the ‘right’ outcomes, even if we didn’t understand how they did this.
Today this theory-free approach to AI is under attack. Scholars have called out the ‘bias in, bias out’ problem of machine-learning systems, showing that biased datasets create biased models — and, by extension, biased predictions. That’s why policy makers now demand that if AI systems are used to make public decisions, their models need to be ‘explainable’, offering justifications for the predictions they make.
Yet, a deeper problem is rarely addressed. It is not just the selection of training data, or the design of algorithms, that embeds bias and fails to represent the world we want to live in. The underlying data structures and infrastructures on which AI is founded were rarely built with AI uses in mind, and the data standards — or lack thereof — used by those datasets place hard limits on what AI can deliver.
Questionable assumptions
From form fields for gender that only offer a binary choice, to disagreements over whether or not a company’s registration number should be a required field when applying for a government contract, data standards define the information that will be available to machine-learning systems. They set in stone hidden assumptions and taken-for-granted categories that make possible certain conclusions, while ruling others out, before the algorithm even runs. Data standards tell you what to record, and how to represent it. They embody particular world views, and shape the data that shapes decisions.
For corporations planning to use machine-learning models with their own data, creating a new data field or adapting available data to feed the model may be relatively easy. But for the public good uses of AI, which frequently draw on data from many independent agencies, individuals or sectors, syncing data structures is a challenging task.
Opening up AI infrastructure
However, there is hope. A number of open data standards projects have launched since 2010.
They include the International Aid Transparency Initiative (IATI) — which works with international aid donors to encourage them to publish project information in a common structure — and HXL, the Humanitarian eXchange Language, which offers a lightweight approach to structure spreadsheets with ‘Who, What, Where’ information from different agencies engaged in disaster response activities.
When these standards work well, they allow a broad community to share data that represents their own reality, and make data interoperable with that from others. But for this to happen, standards must be designed with broad participation so that they avoid design choices that embed problematic cultural assumptions, create unequal power dynamics, or strike the wrong balance between comprehensive representation of the world and simple data preparation. Without the right balance certain populations may drop out of the data sharing process altogether.
To use AI for the public good, we need to focus on the data substrata on which AI systems are built. This requires a primary focus on data standards, and far more inclusive standards development processes. Even if machine learning allows us to ask questions of data in new ways, we cannot shirk our responsibility to consciously design data infrastructures that make possible meaningful and socially just answers.
*I’ve only got print copies of the publication right now: happy to share locally in Stroud, and will update with a link to digital versions when available. Thanks to Dor Glick at Rockefeller for the invite and brief for this piece, and to Carolyn Whelan for editing.
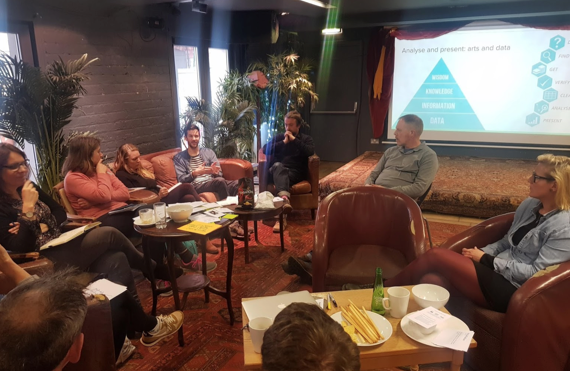
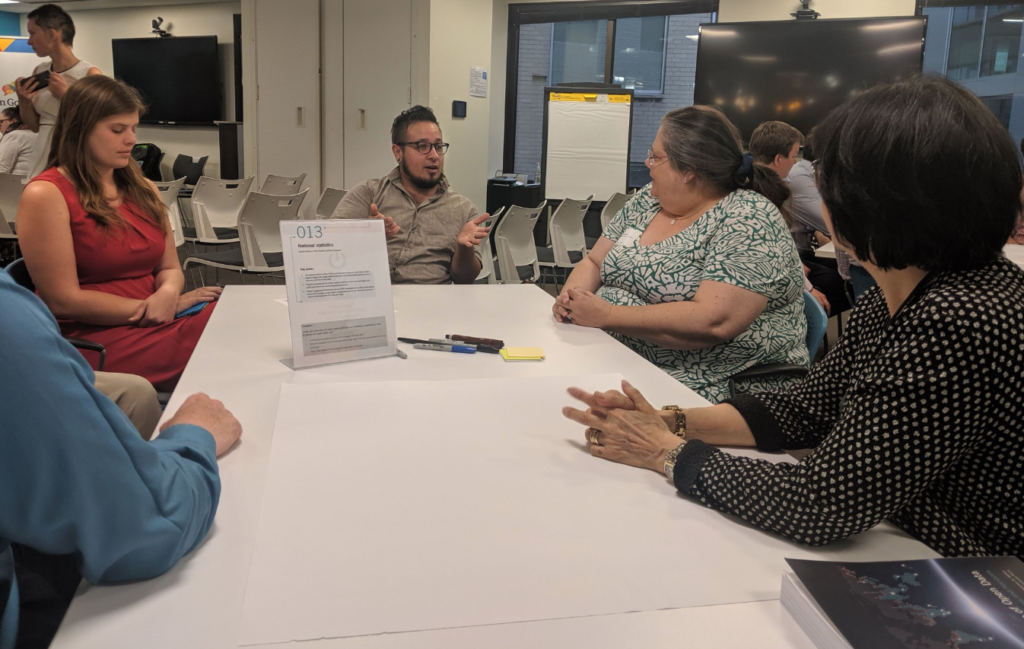
[Summary: report from a one day workshop with Create Gloucestershire bringing together artists and technologists to create artworks responding to data. Part 2 in a series with Exploring Arts Engagement with (Open) Data]
What happens when you bring together a group of artists, scientists, teachers and creative producers, with a collection of datasets, and a sprinkling of technologists and data analysts for a day? What will they create? What can we learn about data through the process?
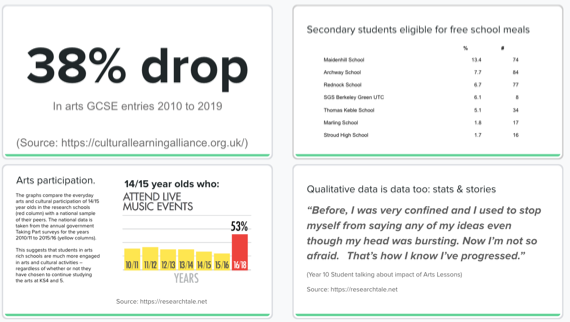
The steady decline in education spending and increased focus on STEM subjects has impacted significantly on arts teaching and teachers. The knock on effect is observed in the take up of arts subjects at secondary, further and higher education level and, ultimately, impacting negatively on the arts and cultural sector in the UK. As such, Create Gloucestershire has been piloting new work in Gloucestershire schools to embed new creative curriculum approaches, supporting its mission to ‘make arts everyday for everyone’. The cultural education agenda therefore provided a useful ‘hook’ for this data exploration.
Data: preparation
We started thinking about the idea of a ‘art and data hackathon’ at the start of this year, as part of Create Gloucestershire’s data maturity journey and decided to focus on questions around cultural education in Gloucestershire. However, we quickly realised an event could not be entirely modelled on a classic coding hackathon event, so, in April we brought together a group of potential participants for a short design meeting.
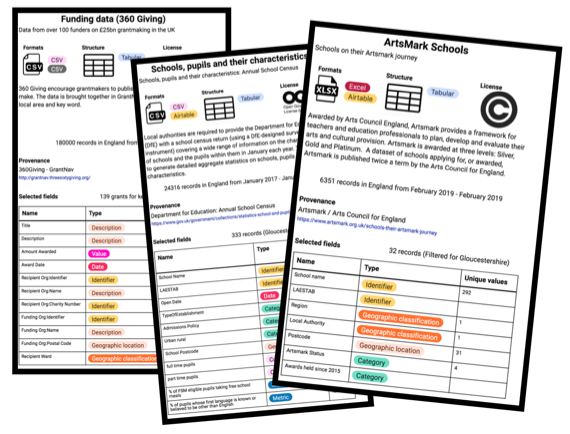
For this, we sought out a range of datasets about schools, arts education, arts teaching and funding for arts activities – and I worked to prepare Gloucestershire extracts of these datasets (slimming them down from hundreds of columns and rows) . Inspired by the Dataset Nutrition Project project, and using AirTable blocks to rapidly create a set of cards, we took along profiles of some of these datasets to help give participants at the planning meeting a sense of what might be found inside each of the datasets we looked at.
Through this planning meeting we were able to set our expectations about the kind of analysis and insights we might get to from these datasets, and to think about placing the emphasis of the day on collaboration and learning, rather than being overly directive about the questions to be answered with data. We also decided that, in order to help collaborative groups form in the workshop, and to make sure we had materials prepared for particular art forms, we would invite a number of artists to act as anchor facilitators on the day.
Culture: the hackathon day
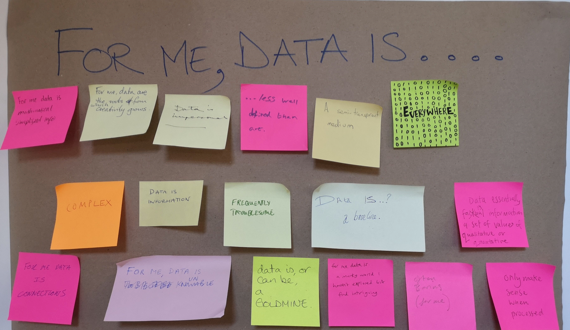
After an overview of Create Gloucestershire’s mission to bring about ‘arts everyday for everyone’, we began with introductions, going round the group and completing three sentences:
For me, data is…
For me, arts everyday is…
In Gloucestershire, is arts everyday….?
Through this, we began to surface different experiences of engagement with data (everywhere; semi-transparent; impersonal; information; a goldmine; less well defined than art; complex; connective…), and with questions of access to arts (Arts everyday is: fun; making sense of the world; what you make of it; necessary; a privilege for some; an improbable dream; essential).
We then turned briefly to look at some of the data available to explore these questions, before inviting our artists to explain the tools and approaches they had brought along to share:
Barney Heywood of Stand + Stare demonstrated use of touch-sensitive tape to create physical installations that respond to an audience with sound or visuals, as well as the Mayfly app that links stickers and sounds;
Illustrator and filmmaker, Joe Magee described the power of the pen, and how to sketch out responses to data;
Digital communications consultant and artist, Sarah Dixon described the use of textiles and paper to create work that mixes 2D and 3D; and
Architect Tomas Millar introduced a range of Virtual Reality technologies, and how tools from architecture and gaming could be adapted to create data-related artworks.
To get our creative ideas flowing, we then ran through some rapid idea generation, with everyone rotating around our four artists groups, and responding to four different items of data (below) with as many different ideas as possible. From the 30+ ideas generated came some of the seeds of the works we then developed during the afternoon.
Following a short break, everyone had the chance to form groups and dig deeper into designing an artwork, guided by a number of questions:
What response to data do group members want to focus on? Collecting data? Data representation? Interpretation and response? Or exploring ‘missing data’?
Is there a story, or a question you want to explore?
Who is the audience for your creation?
What data do you need? Individual numbers; graphs; tables; geo data; qualitative data; network data or some other form?
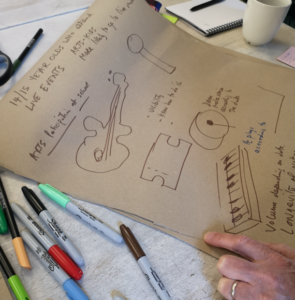
Sketching early ideas
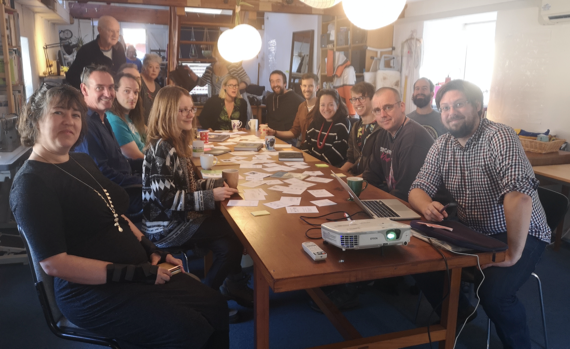
Groups then had around three hours to start making and creating prototype artworks based on their ideas, before we reconvened for a showcase of the creations.
The process was chaotic and collaborative. Some groups were straight into making: testing out the physical properties of materials, and then retrofitting data into their works later. Others sought to explore available datasets and find the stories amongst a wall of statistics. In some cases, we found ourselves gathering new data (e.g. lists of extracurricular activities taken from school websites), and in others, we needed to use exploratory data visualisation tools to see trends and extrapolate stories that could be explored through our artforms. People moved between groups to help create: recording audio, providing drawings, or sharing skills to stimulate new ways of increasing access to the stories within the data. Below is a brief summary of some of the works created, followed by some reflections on learning from the day.
The artworks
Interactive audio: school subjects in harmony
Artwork: Barney Heywood and team | Photo credit: Kazz Hollick
Responding to questions about the balance of the school curriculum, and the low share of teaching hours occupied by the arts, the group recorded a four-part harmony audio clip, and set the volume of each part relative to the share of teaching time for arts, english, sciences and humanities. Through a collection of objects representing each subject, audiences could trigger individual parts, all four parts together, or a distorted version of the harmony. Through inviting interaction, and using volume and distortion, the piece invited reflection on the ‘right’ balance of school subjects, and the effect of loosing arts from the curriculum for the overall harmony of education.
Fabric chromatography: creative combinations
Artwork: Sarah Dixon and team. Photo credit: Jay Haigh
Picking up on a similar theme, this fabric based project sought to explore the mix of extracurricular activities available at a school, and how access to a range of activities can interact to support creative education. Using strips of fabric, woven in a grid onto a backcloth, the work immersed a dangling end of each strip in coloured ink, the mix of inks depending on the range of arts activities available at a particular school. As the ink soaked up vertical strands of the fabric, it also started to seep into horizontal strands, which could mix with other colours. The colours chosen reflected a chart representation of the dataset used to inform the work, establishing a clear link between data, information, and art work.
This work offered a powerful connection between art, data and science: allowing an exploration of how the properties of different inks, and different fabrics, could be used to represent data on ‘absorption’ of cultural education, and the benefits that may emerge from combining different cultural activities. The group envisaged works like this being developed with students, and then shown in the reception area of a school to showcase it’s cultural offer.
The shrinking design teacher (VR installation)
Artwork: Tomas Millar & Pip Heywood. Photo credit: Jay Haigh
Using a series of photographs taken on a mobile phone, a 3D model of representation of Pip, a design teacher, was created in a virtual landscape. An audio recording of Pip describing the critical skill sets engendered through design teaching was linked to the model, which was set to shrink in size over the time of the recording reflecting 7-years of data on the reduction in design teaching hours in school.
Observed through VR goggles, the piece offered an emotive way to engage with a narrative on the power of art to encourage critical questioning of structures, and to support creative engagement with the world, all whilst – imperceptibly at first, and more clearly as the VR observer finds themselves looking down at the shrinking teacher – highlighting current trends in teaching hours.
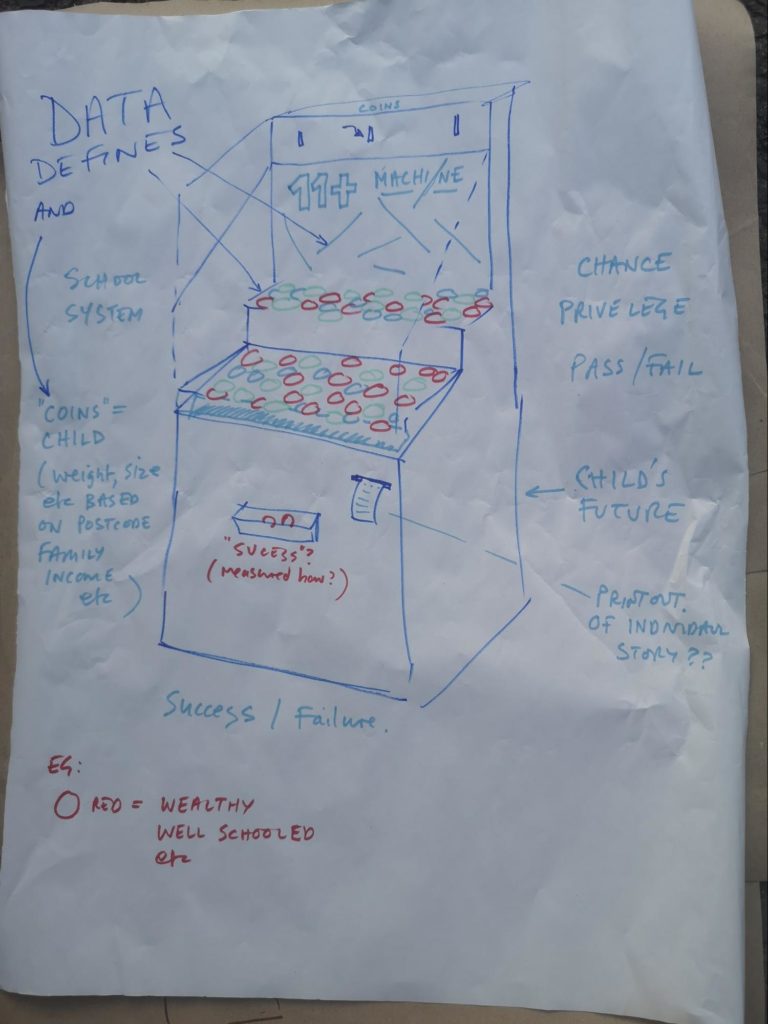
Arcade mechanicals
Artwork: Joe Magee and team. Photo credit: Jay Haigh
From the virtual to the physical, this sketch questioned the ‘rigged’ nature of grammar school and private education, imagining an arcade machine where the weight, size and shape of tokens were set according to various data points, and where the mechanism would lead to certain tokens having a better chance of winning.
By exploring a data-informed arcade mechanisms, this idea captures the idea that statistical models can tell us something about potential future outcomes, but that outcomes are not entirely determined, and there are still elements of chance, or unpredictable interactions, in any individual story.
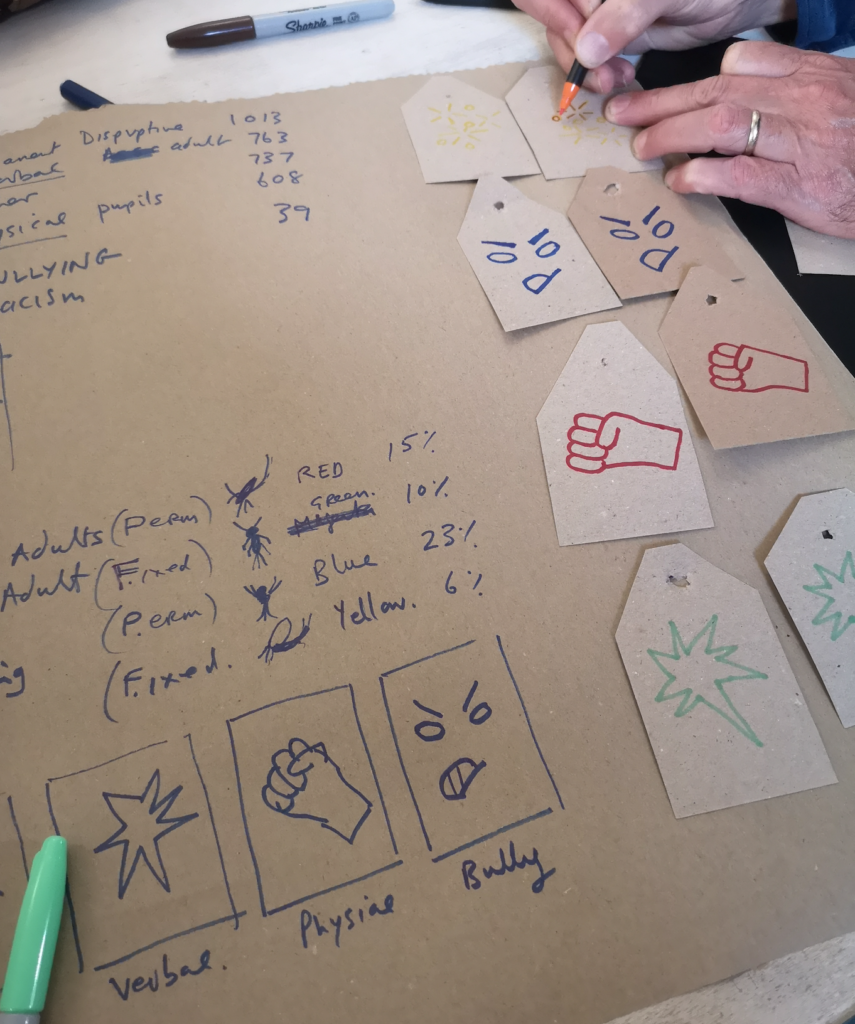
Exclusion tags
Artwork: Joe Magee, Sarah Dixon and team. Photo: Jay Haigh
Building on data about different reasons for school exclusion, eight workshop participants were handed paper tags, marking them out for exclusion from the ‘classroom’. They were told to leave the room, where the images on their tags were scanned (using the Mayfly app) playing them a cold explanation of why they have been excluded and for how long.
The group were then invited to create a fabric based sculpture to represent the percentage of children excluded from school in Gloucestershire for the reasons indicated on their tag.
The work sought to explore the subjective experience of being excluded, and to look behind the numbers to the individual stories – whilst also prototyping a possible creative yarn-bombing workshop that could be used with excluded young people to re-engage them with education.
The team envisaged a further set of tags linked to personal narratives collected from young people excluded from school, bringing their voices into the piece to humanise the data story.
Library lights: stories from library users
This early prototype explored the potential VR to let an audience explore a space, shedding light on areas that are otherwise in darkness. Drawing on statistics about the fact that 33% of people use libraries, and on audio recordings – drawn from direct participant quotes collected by Create Gloucestershire during their 3-year Art of Libraries test programme describing how people benefitted from engagement with arts interventions in libraries across Gloucestershire – a virtual space was populated with 100 orbs – the percentage lit relating to those who use libraries. As the audience in VR approached a lit orb, an audio recording of an individual experience with a library would play.
The creative team envisaged the potential to create a galaxy of voices: offseting negative comments about libraries from those that don’t use them (they were able to find a significant number of data sets showing negative perceptions about libraries, but few positive ones) with the good experiences of those that do.
Artwork: Tomas Millar and team (image to come)
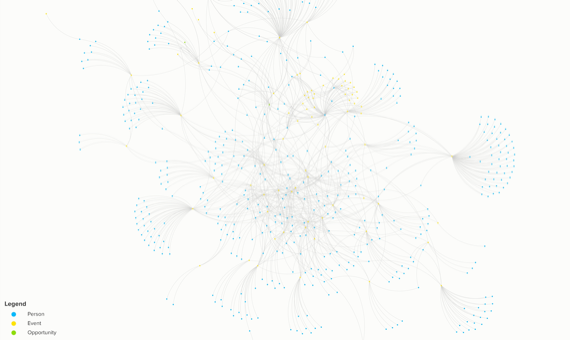
Seeing our networks
Not so much an artwork, as a data visualisation, this piece took data gathered over the last five years by Create Gloucestershire to record attendance at Create Gloucestershire events. Adding in data on attendance at the Creative Lab, lists of people, events and event participation (captured and cleaned up using the vTiger CRM), were fed into Kumu, and used to build an interactive network diagram. The visual allows an identification of how, over time, CG events have both engaged with new people (out on the edge of the network), and have started to build ongoing connections.
A note on naming
*One things we forgot to do (!) in our process was to ask each group to title their works, so the titles and descriptions above are given by the authors of this post. We will happily amend with input from each group.
Learning
We closed our workshop reflecting on learning from the day. I was particularly struck by the way in which responding to dataset through the lens of artistic creation (and not just data visualisation) provided opportunities to ask new questions of datasets, and to critically question their veracity and politics: digging into the stories behind each data point, and powerfully combining qualitative and quantitative data to look not just at presenting data, but finding what it might mean for particular audiences.
However, as Joe Magee framed it, it wasn’t always easy to find a route up the “gigantic data coalface”. Faced with hundreds of rows and columns of data, it was important to have access to tools and skills to carry out quick visualisations: yet knowing the right tools to use, or how to shape data so that it can be easily visualised, is not always straightforwards. Unlike a classic data hackathon, where there are often demands for the ‘raw data’, a data and art creative lab benefits from more work to prepare data extracts, and to provide access to layers of data (individual data points, a small set they belong in, the larger set they come from) .
Our journey, however, took use beyond the datasets we had pre-prepared. One particular resource we came across was the UK Taking Part Survey which offers a range of analysis tools to drill down into statistics on participation in art forms by age, region and socio-economic status. With this dataset, and a number of others, our expectations were often confounded when, for example, relationships we had expected to find between poverty and arts participation, or age and involvement, were not borne out in the data.
This points to a useful symmetry: turning to data allowed us to challenge the assumptions that might otherwise be baked into an agenda-driven artwork, but engaging with data through an arts lens also allowed us to challenge the assumptions behind data points, and behind the ways data is used in policy-making.
We’ve also learnt more about how to frame an event like this. We struggled to describe it in advance and to advertise it. Too much text was the feedback from some! Now with images of this event, we can think about ways to provide a better visual story for future workshops of what might be involved.
Given Create Gloucestershire’s commitment to arts everyday for everyone as a wholly inclusive statement of intent, it was exciting to see collaborators on the day truly engaging with data in a way they may not have done previously, and then expanding access to it by representing data in accessible and engaging forms which, additionally, could be explored by subjects of the data themselves. What might have seemed “boring” or “troublesome” at the start of the day become a font of inspiration and creativity, opening up new conversations that may never have previously taken place and setting up the potential for new collaborations, conversations, advocacy and engagement.
Thanks
Thank you to the team at Create Gloucestershire for hosting the day, and particularly to Caroline, Pippa and Jay for all the organisation. Thanks to Kat at Atelier for hosting us, and to our facilitating artists: Barney, Sarah, Thomas and Joe. And thanks to everyone who gave up a Saturday to take part!
[Summary: an argument for the importance of involving civil society, and thinking broad when exploring the concept of high value data (with lots of links to past research and the like smuggled in)]
On 26th June this year the European Parliament and Council published an update to the Public Sector Information (PSI) directive, now recast as Directive 2019/1024 “on open data and the re-use of public sector information”.The new text makes a number of important changes, including bringing data held by publicly controlled companies in utility and transport sectors into the scope of the directive, extending coverage of research data, and seeking to limit the granting of exclusive private sector rights to data created during public tasks, and increase the transparency when such rights are granted.
However, one of the most significant changes of all is the inclusion of Article 14 on High Value Datasets which gives the Commission power to adopt an implementing act “laying down a list of specific high-value datasets” that member states will be obliged to publish under open licenses, and, in some cases, using certain APIs and standards. The implementing acts will have the power to set out those standards. This presents a major opportunity to shape the open data ecosystem of Europe for decades to come.
A few weeks back, a number of open data researchers and campaigners had a quick call to discuss ways to make sure past research, and civil society voices, inform the work that goes forward. As part of that, I agreed to draft a short(ish) post exploring the concept of high value data, and looking at some of the issues that might need to be addressed in the coming months. I’d hoped to co-draft this with colleagues, but with summer holidays and travel having intervened, am instead posting a sole authored post, with an invite to others to add/dispute/critique etc.
Notably, whilst it appears few (if any) open-data related civil society organisations are in a position to lead a response to the current EC tender, the civil society open data networks built over the last decade in Europe have a lot to offer in identifying, exploring and quantifying the potential social value of specific open datasets.
What counts as high value?
The Commission’s tender points towards a desire for a single list of datasets that can be said to exist in some form in each member state. The directive restricts the scope of this list to six domains: geospatial, earth observation and environment, meteorological, statistical, company and company ownership, and mobility-related datasets. It also appears to anticipate that data standards will only be prescribed for some kinds of data: highlighting a distinction between data that may be high value simply by virtue of publication, and data which is high-value by virtue of it’s interoperability between states.
In the new directive, the definition of ‘high value datasets’ is put as:
“documents the re-use of which is associated with important benefits for society, the environment and the economy, in particular because of their suitability for the creation of value-added services, applications and new, high-quality and decent jobs, and of the number of potential beneficiaries of the value-added services and applications based on those datasets;” (§2.10)
Although the ordering of society, environment and economy is welcome, there are subtle but important differences from the definition advanced in a 2014 paper from W3C and PwC for the European Commission which described a number of factors for determining whether there was high value to making a dataset open (and standardising it in some ways). It focussed attention on whether publication of a dataset:
Contributes to transparency
Helps governments meet legal obligations
Relates to a public task
Realises cost reductions; and
Has some value to a large audience, or substantial value to a smaller audience.
Although the recent tender talks of identifying “socio-economic” benefits of datasets, overall it adopts a strongly economic frame, seeking quantification of these and asking in particular for evaluation of “potential for AI applications of the identified datasets;”. (This particular framing of open data as a raw material input for AI is something I explored in the recent State of Open Data book, where the privacy chapter also picked up on a brief exploration how AI applications may also create new privacy risks for release of certain datasets.) But to keep wider political and social uses of open data in view, and to recognise that quantification of benefits is not a simple process of adding up the revenue of firms that use that data, any comprehensive method to explore high value datasets will need to consider a range of issues, including that:
Value is produced in a range of different ways
Not all future value can be identified from looking at existing data use cases
Value may result from network effects
Realising value takes more than data
Value is a two-sided calculation; and
The distribution of value matters as well as the total amount
I dig into each of these below.
Value is produced in different ways
A ‘raw material’ theory of change still pervades many discussions of open data, in spite of the growing evidence base about the many different ways that opening up access to data generates value. In ‘raw material’ theory, open data is an input, taken in by firms, processed, and output as part of new products and services. The value of the data can then be measured in the ‘value add’ captured from sales of the resulting product or service. Yet, this only captures a small part of the value that mandating certain datasets be made open can generate. Other mechanisms at play can include:
Risk reduction. Take, for example, beneficial ownership data. Quite asides from the revenue generated by ‘Know Your Customer (KYC)’ brokers who might build services off the back of public registers of beneficial ownership, consider the savings to government and firms from not being exposed to dodgy shell-companies, and the consumer surplus generated by supporting a clamp down on illicit financial flows into the housing market by supporting more effective cross-border anti-money laundering investigations. OpenOwnership are planning research later this year to dig more into how firms are using, or could use, beneficial ownership transparency data including to manage their exposure to risk. Any quantification needs to take into account not only value gained, but also value ‘not lost’ because a dataset is made open.
Internal efficiency and innovation. When data is made open, and particularly when standards are adopted, it often triggers a reconfiguration of data practices inside the data (c.f. Goëta & Davies), with the potential for this to support more efficient working, and enable innovation through collaboration between government, civil society and enterprise. For example, the open publication of contracting data, particularly with the adoption of common data standards, has enabled a number of governments to introduce new analytical tools, finding ways to get a better deal on the products and services they buy. Again, this value for money for the taxpayer may be missed by a simple ‘raw material’ theory.
Political and rights impacts. The 2014 W3C/PWC paper I cited earlier talks about identifying datasets with “some value to a large audience, or substantial value to a smaller audience.”. There may also be datasets that have low likelihood of causing impact, but high impact (at least for those affected) when they do. Take, for example, statistics on school admissions. When I first looked at use of open data back in 2009, I was struck by the case of an individual gaining confidence from the fact that statistics on school admission appeals were available (E7) when constructing an appeal case against a school’s refusal to admit their own child. The open availability of this data (not necessarily standardised or aggregated) had substantial value to empowering a citizen in securing their rights. Similarly, there are datasets that are important for communities to secure their rights (e.g. air quality data), or to take political action to either enforce existing policy (e.g. air quality limits), or to change policy (e.g. secure new air quality action zones). No only is such value difficult to quantify, but whether or not certain data generates value will vary between countries in accordance with local policies and political issues. The definition of EU-wide ‘high value datasets’ should not crowd out the possibility or process of defining data that is high-value in particular country. That said, there may at least be scope to look at datasets in the study categories that have substantial potential value in relation to EU social and environmental policy priorities.
Beyond the mechanisms above, there may also be datasets where we find a high intrinsic value in the transparency their publication brings, even without a clear evidence base that can quantifies their impact. In these cases, we might also talk of the normative value of openness, and consider which datasets deserve a place on the high-value list because we take the openness of this data to be foundational to the kind of societies we want to live in, just as we may take certain freedoms of speech and movement as foundational to the kind of Europe we want to see created.
Not all value can be found from prior examples
The tender cites projects like the Open Data Barometer (which I was involved in developing the methodology for) as potential inspirations for the design of approaches to assess “datasets that should belong to the list of high value datasets”. The primary place to look for that inspiration is not in the published stats, but in the underlying qualitative data which includes raw reports of cases of political, social and economic impact from open data. This data (available for a number of past editions of the Barometer) remains an under-explored source of potential impact cases that could be used to identify how data has been used in particular countries and settings. Equally, projects like the State of Open Data can be used to find inspiration on where data has been used to generate social value: the chapter on Transport is as case-in-point, looking at how comprehensive data on transport can support applications improving the mobility of people with specific needs.
However, many potential uses and impacts of open data are still to be realised, because the data they might work with has not heretofore been accessible. Looking only at existing cases of use and impact is likely to miss such cases. This is where dialogue with civil society becomes vitally important. Campaigners, analysts and advocates may have ideas for the projects that could exist if only particular data was available. In some cases, there will be a hint at what is possible from academic projects that have gained access to particular government datasets, or from pilot projects where limited data was temporarily shared – but in other cases, understanding potential value will require a more imaginative and forward-looking and consultative process. Given the upcoming study may set the list of high value datasets for decades to come – it’s important that the agenda is not be solely determined by prior publication precedent.
For some datasets, certain value comes from network effects
If one country provides an open register of corporate ownership, the value this has for anti-corruption purposes only goes so far. Corruption is a networked game, and without being able to following corporate chains across borders, the value of a single register may be limited. The value of corporate disclosures in one jurisdiction increase the more other jurisdictions provide such data. The general principle here, that certain data gains value through network effects, raises some important issues for the quantification of value, and will help point towards those datasets where standardisation is particularly important. Being able to show, for example, that the majority of the value of public transit data comes from domestic use (and so interoperability is less important), but the majority of value of, say, carbon emission or climate change mitigation financing data, comes from cross-border use, will be important to support prioritisation of datasets.
Value generation takes more than data
Another challenge of of the ‘raw material’ theory of change is that it often fails to consider (a) the underlying quality (not only format standardisation) of source data, and (b) the complementary policies and resources that enable use. For example, air quality data from low-quality or uncalibrated particulate sensors may be less valuable than data from calibrated and high quality sensors, particularly when national policy may set out criteria for the kinds of data that can be used in advancing claims for additional environmental protections in high-pollution areas. Understanding this interaction of ‘local data’ and the governance contexts where it is used is important in understanding how far, and under what conditions, one may extrapolate from value identified in one context, to potential value to be realised in another. This calls for methods that can go beyond naming datasets, to being able to describe features (not just formats) that are important for them to have.
It can be temping to quantify the value of a dataset simply by taking all the ‘positive’ value it might generate, and adding it up. But, a true quantification calculation also needs to consider potential negative impacts. In some cases, this could be positive economic value set against some social or ecological dis-benefit. For example, consider the release of some data that might increase use of carbon-intensive air and road transport. While this could generate quantifiable revenue for haulage and airline firms, it might undermine efforts to tackle climate change, destroying long-term value. Or in other cases, there may be data that provides social benefit (e.g. through the release of consumer protection related data) but that disrupts an existing industry in ways that reduce private sector revenues.
Recognising the power of data, involves recognising that power can be used in both positive and negative ways. A complete balance sheet needs to consider the plus and the minus. This is another key point where dialogue with civil society will be vital – and not only with open data advocates, but with those who can help consider the potential harms of certain data being more open.
Distribution of value matters
Last but not least, when considering public investment in ‘high value’ datasets, it is important to consider who captures that value. I’ve already hinted at the fact that value might be captured as government surplus, consumer surplus or producer (private sector) surplus – but there are also relevant question to ask about which countries or industries may be best placed to capture value from cross-border interoperable datasets.
When we see data as infrastructure, then it can help us consider the potential to both provide infrastructure that is open to all and generative of innovation, but also to design policies that ensure those capturing value from the infrastructure are contributing to its maintenance.
In summary
Work on methodologies to identify high value datasets in Europe should not start from scratch, and stand to benefit substantially from engaging with open data communities across the region. There is a risk that a narrow conceptualisation and quantification of ‘high value’ will fail to capture the true value of openness, and to consider the contexts of data production and use. However, there is a wealth of research from the last decade (including some linked in this post, and cited in State of Open Data) to build upon, and I’m hopeful that whichever consultant or consortium takes on the EC’s commissioned study, they will take as broad a view as possible within the practical constraints of their project.
[Summary: extended notes from an unConference session]
At the recent data literacy focussed Open Government Partnership unConference day (ably facilitated by my fellowStroudieDirk Slater) I acted as host for a break-out discussion on ‘Artificial Intelligence and Data Literacy’, building on the‘Algorithms and AI’ chapter I contributed toThe State of Open Data book.
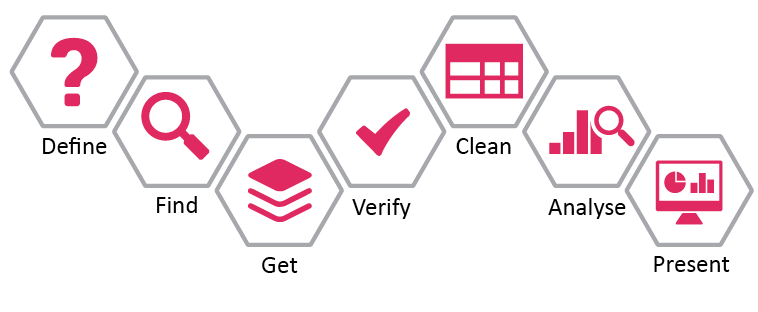
In that chapter, I offer the recommendation that machine learning should be addressed within wider open data literacy building. However, it was only through the unConference discussions that we found a promising approach to take that recommendation forward: encouraging a critical look at how AI might be applied at each stage of the School of Data ‘Data Pipeline’.
The Data Pipeline, which features in theData Literacy chapter of The State of Open Data, describes seven stages for woking with data, from defining the problem to be addressed, through to finding and getting hold of relevant data, verifying and cleaning it, and analysing data and presenting findings.
Figure: The School of Data’s data pipeline. Source: https://schoolofdata.org/methodology/
Often, AI is described as a tool for data analysis (any this was the mental framework many unConference session participants started with). Yet, in practice, AI tools might play a role at each stage of the data pipeline, and exploring these different applications of AI could support a more critical understanding of the affordances, and limitations, of AI.
The following rough worked example looks at how this could be applied in practice, using an imagined case study to illustrate the opportunities to build AI literacy along the data pipeline.
(Note: although I’ll use machine-learning and AI broadly interchangeably in this blog post, as Ioutline in the State of Open Data Chapter, AI is a broader concept than machine-learning.)
Worked example
Imagine a human rights organisation, using a media-monitoring service to identify emerging trends that they should investigate. The monitoring service flags a spike in gender based violence, encouraging them to seek out more detailed data. Their research locates a mix of social media posts, crowdsourced data from a harassment mapping platform, and official statistics collected in different regions across the country. They bring this data together, and seek to check it’s accuracy, before producing an analysis and visually impactful report.
As we unpack this (fictional) example, we can consider how algorithms and machine-learning are, or could be, applied at each stage – and we can use that to consider the strengths and weaknesses of machine-learning approaches, building data and AI literacy.
Define – The patterns that first give rise to a hunch or topic to investigate may have been identified by an algorithmic model. How does this fit with, or challenge, the perception of staff or community members? If there is a mis-match – is this because the model is able to spot a pattern than humans were not able to see (+1 for the AI)? Or could it be because the model is relying on input data that reflects certain bias (e.g. media may under-report certain stories, or certain stories may be over-reported because of certaincognitive biases amongst reporters)?
Find – Search engine algorithms may be applying machine-learning approaches to identify and rank results. Machine-translation tools, that could be used to search for data described in other languages, are also an example of really well established AI. Consider the accuracy of search engines and machine-translation: they are remarkable tools, but we also recognise that they are nowhere near 100% reliable. We still generally rely on a human to sift through the results they give.
Get – One of the most common, and powerful, applications of machine-learning, is in turning information into data: taking unstructured content, and adding structure through classification or data extraction. For example, image classification algorithms can be trained to convert complex imagery into a dataset of terms or descriptions; entity extraction and sentiment analysis tools can be used to pick out place names, event descriptions and a judgement on whether the event described is good or bad, from free text tweets, and data extraction algorithms can (in some cases) offer a much faster and cheaper way to transcribe thousands of documents than having humans do the work by hand. AI can, ultimately, change what counts as structured data or not. However, that doesn’t mean that you can get all the data you need using AI tools. Sometimes, particularly where well-defined categorical data is needed, getting data may require creation of new reporting tools, definitions and data standards.
Verify – School of Data describe the verification step like this: “We got our hands in the data, but that doesn’t mean it’s the data we need. We have to check out if details are valid, such as the meta-data, the methodology of collection, if we know who organised the dataset and it’s a credible source.” In the context of AI-extracted data, this offers an opportunity to talk about training data and test data, and to think about the impact that tuning tolerances to false-positives or false-negatives might have on the analysis that will be carried out. It also offers an opportunity to think about the impact that different biases in the data might have on any models built to analyse it.
Clean – When bringing together data from multiple sources, there may be all sorts of errors and outliers to address. Machine-learning tools may prove particularly useful for de-duplication of data, or spotting possible outliers. Data cleaning to prepare data for a machine-learning based analysis may also involve simplifying a complex dataset into a smaller number of variables and categories. Working through this process can help build an understanding of the ways in which, before a model is applied, certain important decisions have already been made.
Analyse – Often, data analysis takes the form of simple descriptive charts, graphs and maps. But, when AI tools are added to the mix, analysis might involve building predictive models, able, for example, to suggest areas of a county that might see future hot-spots of violence, or that create interactive tools that can be used to perform ongoing monitoring of social media reports. However, it’s important in adding AI to the analysis toolbox, not to skip entirely over other statistical methods: and instead to think about the relative strengths and weaknesses of a machine-learning model as against some other form of statistical model. One of the key issues to consider in algorithmic analysis is the ’n’ required: that is, the sample size needed to train a model, or to get accurate results. It’s striking that many machine-learning techniques required a far larger dataset that can be easily supplied outside big corporate contexts. A second issue that can be considered in looking at analysis is how ‘explainable’ a model is: does the machine-learning method applied allow an exploration of the connections between input and output? Or is it only a black box.
Present – Where the output of conventional data analysis might be a graph or a chart describing a trend, the output of a machine-learning model may be a prediction. Where a summary of data might be static, a model could be used to create interactive content that responds to user input in some way. Thinking carefully about the presentation of the products of machine-learning based analysis could support a deeper understanding of the ways in which such outputs could or should be used to inform action.
The bullets above give just some (quickly drafted and incomplete) examples of how the data pipeline can be used to explore AI-literacy alongside data literacy. Hopefully, however, this acts as enough of a proof-of-concept to suggest this might warrant further development work.
The benefit of teaching AI literacy through open data
I also argue in The State of Open Data that:
AI approaches often rely on centralising big datasets and seeking to personalise services through the application of black-box algorithms. Open data approaches can offer an important counter-narrative to this, focusing on both big and small data and enabling collective responses to social and developmental challenges.
Operating well in a datified world requires citizens to have a critical appreciation of a wide variety of ways in which data is created, analysed and used – and the ability to judge which tool is appropriate to which context. By introducing AI approaches as one part of the wider data toolbox, it’s possible to build this kind of literacy in ways that are not possible in training or capacity building efforts focussed on AI alone.
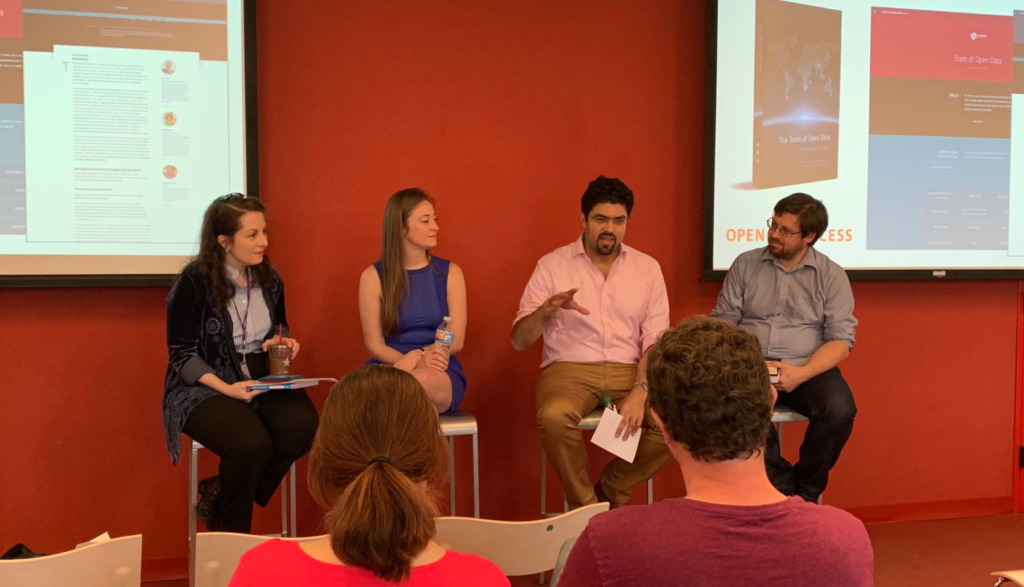
Over the last week I’ve had the opportunity to share findings from The State of Open Data: Histories and Horizons in a number of different settings: from academic roundtables, to conference presentations, and discussion panels.
Each has been an opportunity not only to promote the rich open access collection of essays just published, but also a chance to explore the many and varied chapters of the book as the starting point for new conversation about how to take forward an open approach to data in different settings and societies.
In this post I’m going to try and reflect on a couple of themes that have struck me during the week. (Note: These are, at this stage, just my initial and personal reflections, rather than a fully edited take on discussions arising from the book.)
Panel discussion at the GovLab with Tariq Khokhar, Adrienne Schmoeker and Beth Noveck.
Renewing open advocacy in a changed landscape
The timeliness of our look at the Histories and Horizons of open data was underlined on Monday when a tweet from Data.gov announced this week as their 10th anniversary, and the Open Knowledge Foundation, also celebrated their 15th birthday with a return to their old name, a re-focussed mission to address all forms of open knowledge, and an emphasis on creating “a future that is fair, free and open.”As they put it:
”…in 2019, our world has changed dramatically. Large unaccountable technology companies have monopolised the digital age, and an unsustainable concentration of wealth and power has led to stunted growth and lost opportunities. “
going on to say
“we recognise it is time for new rules for this new digital world.”
Not only is this a welcome and timely example of the kind of “thinking politically” we call for in the State of Open Data conclusion, but it chimes with many of the discussions this week, which have focussed as much on the ways in which private sector data should be regulated as they have on opening up government data.
While, in tools like the Open Data Charter’s Open Up Guides, we have been able to articulate a general case for opening up data in a particular sector, and then to enumerate ‘high value’ datasets that efforts should attend to, future work may need to go even deeper into analysing the political economy around individual datasets, and to show how a mix of voluntary data sharing, and hard and soft regulation, can be used to more directly address questions about how power is created, structured and distributed through control of data.
As one attendee at our panel at the Gov Lab put it, right now, open data is still often seen as a “perk not a right”.And although ‘right to data’ advocacy has an important role, it is by linking access to data to other rights (to clean air, to health, to justice etc.) that a more sophisticated conversation can develop around improving openness of systems as well as datasets (a point I believe Adrienne Schmoeker put in summing up a vision for the future).
Policy enables, problems drive
So does a turn towards problem-focussed open data initiatives mean we can put aside work on developing open data policies or readiness assessments? In short, no.
In a lunchtime panel at the World Bank, Anat Lewin offered an insightful reflection on The State of Open Data from a multilateral’s perspective, highlighting the continued importance of developing a ‘whole of government’ approach to open data. This was echoed in Adrienne Schmoeker’s description at The Gov Lab of the steps needed to create a city-wide open data capacity in New York. In short, without readiness assessment and open data policies put in place, initiatives that use open data as a strategic tool are likely to rub up against all sorts of practical implementation challenges.
Where in the past, government open data programmes have often involved going out to find data to release, the increasing presence of data science and data analytics teams in government means the emphasis is shifting onto finding problems to solve. Provided data analytics teams recognise the idea of ‘data as a team sport’, requiring not just technical skills, but also social science, civic engagement and policy development skill sets – and providing professional values of openness are embedded in such teams – then we may be moving towards a model in which ‘vertical’ work on open data policy, works alongside ‘horizontal’ problem-driven initiatives that may make less use of the language of open data, but which still benefit from a framework of openness.
Chapter discussions at the OpenGovHub, Washington DC
Political economy really matters
It’s been really good to see the insights that can be generated by bringing different chapters of the book into conversation. For example, at the Berkman-Klein Centre, comparing and contrasting attitudes in North America vs. North Africa towards the idea that governments might require transport app providers like Uber to share their data with the state, revealed the different layers of concern, from differences in the market structure in each country, to different levels of trust in the state. Or as danah boyd put it in our discussions at Data and Society, “what do you do when the government is part of your threat model?”.This presents interesting challenges for the development of transnational (open) data initiatives and standards – calling for a recognition that the approach that works in one country (or even one city), may not work so well in others. Research still does too little to take into account the particular political and market dynamics that surround successful open data and data analytic projects.
A comparisons across sectors, emerging from our ‘world cafe’ with State of Open Data authors at the OpenGovHub also shows the trade-offs to be made when designing transparency, open data and data sharing initiatives. For example, where the extractives transparency community has the benefit of hard law to mandate certain disclosures, such law is comparatively brittle, and does not always result in the kind of structured data needed to drive analysis. By contrast, open contracting, in relying on a more voluntary and peer-pressure model, may be able to refine it’s technical standards more iteratively, but perhaps at the cost of weaker mechanisms to enforce comprehensive disclosure. As Noel Hidalgo put it, there is a design challenge in making a standard that is a baseline, on top of which more can be shared, rather than one that becomes a ceiling, where governments focus on minimal compliance.
It is also important to recognise that when data has power, many different actors may seek to control, influence and ultimately mess with it. As data systems become more complex, the vectors for attack can increase. In discussions at Data & Society, we briefly touched on one cases where a government institution has had to take considerable steps to correct for external manipulation of it’s network of sensors. When data is used to trigger direct policy response (e.g. weather data triggering insurance payouts, or crime data triggering policing action), then the security and scrutiny of that data becomes even more important.
Open data as a strategic tool for data justice
I heard the question “Is open data dead?” a few times over this week. As the introductory presentation I gave for a few talks noted, we are certainly beyond peak open data hype. But, the jury is, it seems, still very much out on the role that discourses around open data should play in the decade ahead. At our Berkman-Klein Centre roundtable, Laura Bacon shared work by Omidyar/Luminate/Dalberg that offered a set of future scenarios for work on open data, including the continued existence of a distinct open data field, and an alternative future in which open data becomes subsumed within some other agenda such as ‘data rights’. However, as we got into discussions at Data & Society of data on police violence, questions of missing data, and debates about the balancing act to be struck in future between publishing administrative data and protecting privacy, the language of ‘data justice’ (rather than data rights) appeared to offer us the richest framework for thinking about the future.
Data justice is broader than open data, yet open data practices may often be a strategic tool in bringing it about. I’ve been left this week with a sense that we have not done enough to date to document and understand ways of drawing on open data production, consumption and standardisation as a form of strategic intervention. If we had a better language here, better documented patterns, and a stronger evidence base on what works, it might be easier to both choose when to prioritise open data interventions, and to identify when other kinds of interventions in a data ecosystem are more appropriate tools of social progress and justice.
Ultimately, a lot of discussions the book has sparked have been less about open data per-se, and much more about the shape of data infrastructures, and questions of data interoperability.In discussions of Open Data and Artificial Intelligence at the OpenGovHub, we explored the failure of many efforts to develop interoperability within organisations and across organisational boundaries. I believe it was Jed Miller who put the challenge succinctly: to build interoperable systems, you need to “think like an organiser” – recognising data projects also as projects of organisational change and mass collaboration. Although I think we have mostly moved past the era in which civic technologists were walking around with an open data hammer, and seeing every problem as a nail, we have some way to go before we have a full understanding of the open data tools that need to be in everyones toolbox, and those that may still need a specialist.
Reconfiguring measurement to focus on openness of infrastructure
One way to support advocacy for openness, whilst avoiding reifying open data, and integrating learning from the last decade on the need to embed open data practices sector-by-sector, could be found in an updated approach to measurement. David Eaves made the point in our Berkman-Klein Centre roundtable that the number of widely adopted standards, as opposed to the number of data portals or datasets, is a much better indicator of progress.
As resource for monitoring, measuring or benchmarking open data per-se becomes more scarce, there is an opportunity to look at new measurement frames that look at the data infrastructure and ecosystem around a particular problem, and ask about the extent of openness, not only of data, but also of governance. A number of conversations this week have illustrated the value of shifting the discussion onto data infrastructure and interoperability: yet (a) the language of data infrastructure has not yet taken hold, and can be hard to pin down; and (b) there is a risk of openness being downplayed in favour of a focus on centralised data infrastructures. Updating open data measurement tools to look at infrastructures and systems rather than datasets may be one way to intervene in this unfolding space.
[Summary: rapid reflections on applying extractives metaphors to data in a international development context]
In yesterday’s Data as Development Workshop at the Belfer Center for Science and International Affairs we were exploring the impact of digital transformation on developing countries and the role of public policy in harnessing it. The role of large tech firms (whether from Silicon Valley, or indeed from China, India and other countries around the world) was never far from the debate.
Although in general I’m not a fan of descriptions of ‘data as the new oil’ (I find the equation tends to be made as part of rather breathless techno-deterministic accounts of the future), an extractives metaphor may turn out to be quite useful in asking about the kinds of regulatory regimes that could be appropriate to promote both development, and manage risks, from the rise of data-intensive activity in developing countries.
Over recent decades, principles of extractives governance have developed that recognise the mineral and hydrocarbon resources of a country as at least partially part of the common wealth, such that control of extraction should be regulated, firms involved in extraction should take responsibility for externalities from their work, revenues should be taxed, and taxes invested into development. When we think about firms ‘extracting’ data from a country, perhaps through providing social media platforms and gathering digital trace data, or capturing and processing data from sensor networks, or even collecting genomic information from a biodiverse area to feed into research and product development, what regimes could or should exist to make sure benefits are shared, externalities managed, and the ‘common wealth’ that comes from the collected data, does not entirely flow out of the country, or into the pockets of a small elite?
Although real world extractives governance has often not resolved all these questions successfully, one tool in the governance toolbox has been theExtractives Industry Transparency Initiative (EITI) . Under EITI, member countries and companiesare required to disclose information on all stages of of the extractives process: from the granting of permissions to operate, through to the taxation or revenue sharing secured, and the social and economic spending that results. The model recognises that governance failures might come from the actions of both companies, and governments – rather than assuming one or the other is the problem or benign. Although transparency alone does not solve governance problems: it can support better debate about both policy design and implementation, and can help address distorting information and power asymmetries that otherwise work against development.
So, what could an analogous initiative look like if applied to international firms involved in ‘data extraction’?
(Note: this is a rough-and-ready thought experiment testing out an extended version of an originally tweet-length thought. It is not a fully developed argument in favour of the ideas explored here).
Data as a national resource
Before conceptualising a ‘data extraction transparency initiative’ we need to first think about what counts as ‘data extraction’.This involves considering the collected informational (and attention) resources of a population as a whole. Although data itself can be replicated (marking a key difference from finite fossil fuels and mineral resources), the generation and use of data is often rival (i.e. if I spend my time on Facebook, I’m not spending it on some other platform, and/or, some other tasks and activities),involves first mover advantages (e.g. the first person who street view maps country X may corner the market), and can be made finite through law (e.g. someone collecting genomic material from a country may gain intellectual property rights protection for their data), or simply through restricting access (e.g. as Jeni considers here, where data is gathered from a community and used to shape policy, without the data being shared back to that community).
We could think then of data extraction as any data collection process which ‘uses up’ a common resource such as attention and time, which reduces the competitiveness of a market (thus shifting consumer to producer surplus), or which reduces the potential extent of the knowledge commons through intellectual property regimes or other restrictions on access and use.Of course, the use of an extracted data resource may have economic and social benefits that feed back to the subjects of the extraction. The point is not that all extraction is bad, but is rather to be aware that data collection and use as an embedded process is definitely not the non-rival, infinitely replicable and zero-cost activity that some economic theories would have us believe.
(Note that underlying this lens is the idea that we should approach data extraction at the level of populations and environments, rather than trying to conceptualise individual ownership of data, and to define extraction in terms of a set of distinct transactions between firms and individuals.)
Past precedent: states and companies
Our model then for data extraction involves a relationship between firms and communities, which we will assume for the moment can be adequately represented by their states. A ‘data extractive transparency initiative’ would then be asking for disclosure from these firms at a country-by-country level, and disclosure from the states themselves. Is this reasonable to expect?
We can find some precedents for disclosure by looking at the most recent Ranking Digital Rights Report, released last week. This describes how many firms are now providing data about government requests for content or account restriction. A number of companies produce detailed transparency reports that describe content removal requests from government, or show political advertising spend. This at least establishes the idea that voluntarily, or through regulation, it is feasible to expect firms to disclose certain aspects of their operations.
The idea that states should disclose information about their relationship with firms is also reasonably well established (if not wholly widespread). Open Contracting, and the kind of project-level disclosure of payments to government that can be see at ResourceProjects.org illustrate ways in which transparency can be brought to the government-private sector nexus.
In short, encouraging or mandating the kinds of disclosures we might consider below is not a new. Targeted transparency has long been in the regulatory toolbox.
Components of transparency
So – to continue the thought experiment: if we take some of the categories of EITI disclosure, what could this look like in a data context?
Legal framework
Countries would publish in a clear, accessible (and machine-readable?) form, details of the legal frameworks relating to privacy and data protection, intellectual property rights, and taxation of digital industries.
This should help firms to understand their legal obligations in each country, and may also make it easier for smaller firms to provide responsible services across borders without current high costs of finding the basic information needed to make sure they are complying with laws country-by-country.
Firms could also be mandated to make their policies and procedures for data handling clear, accessible (and machine-readable?).
Contracts, licenses and ownership
Whenever governments sign contracts that allow private sector to collect or control data about citizens, public spaces, or the environment, these contracts should be public.
(In the Data as Development workshop, Sriganesh related the caseof a city that had signed a 20 year deal for broadband provision, signing over all sorts of data to the private firm involved.)
Similarly, licenses to operate, and permissions granted to firms should be clearly and publicly documented.
Recently, EITI has also focussed on beneficial ownership information: seeking to make clear who is really behind companies. For digital industries, mandating clear disclosure of corporate structure, and potentially also of the data-sharing relationships between firms (as GDPR starts to establish) could allow greater scrutiny of who is ultimately benefiting from data extraction.
Production
In the oil, gas and mining context, firms are asked to reveal production volumes (i.e. the amount extracted). The rise of country-by-country reporting, and project-level disclosure has sought to push for information on activity to be revealed not at the aggregated firm level, but in a more granular way.
For data firms, this requirement might translate into disclosure of the quantity of data (in terms of number of users, number of sensors etc.) collected from a country, or disclosure of country by country earnings.
Revenue collection
One important aspect of EITI has been an audit and reconciliation process that checks that the amounts firms claim to be paying in taxes or royalties to government match up with the amounts government claims to have received. This requires disclosure from both private firms and government.
A better understanding of whose digital activities are being taxed, and how, may support design of better policy that allows a share of revenues from data extraction to flow to the populations whose data-related resources are being exploited.
In yesterday’s workshop, Sriganesh pointed to the way in which some developing country governments now treat telecoms firms as an easy tax collection mechanism: if everyone wants a mobile phone connection, and mobile providers are already collecting payments, levying a charge on each connection, or a monthly tax, can be easy to administer. But, in the wrong places, and at the wrong levels, such taxes may capture consumer rather than producer surplus, and suppress rather than support the digital economy,
Perhaps one of the big challenges for ‘data as development’ when companies in more developed economies may extract data from developing countries, but process it back ‘at home’, is that current economic models may suggest that the biggest ‘added value’ is generated from the application of algorithms and processing. This (combined with creative accounting by big firms) can lead to little tax revenue in the countries from which data was originally extracted. Combining ‘production’ and ‘revenue’ data can at least bring this problem into view more clearly – and a strong country-by-country reporting regime may even allow governments to more accurately apply taxes.
Revenue allocation, social and economic spending
Important to the EITI model, is the idea that when governments do tax, or collect royalties, they do so on behalf of the whole polity, and they should be accountable for how they are then using the resulting resources.
By analogy, a ‘data extraction transparency initiative’ initiative may include requirements for greater transparency about how telecoms and data taxes are being used. This could further support multi-stakeholder dialogue on the kinds of public sector investments needed to support national development through use of data resources.
Environmental and social reporting
EITI encourages countries to ‘go beyond the standard’ and disclose other information too, including environmental information and information on gender.
Similar disclosures could also form part of a ‘data extraction transparency initiative’: encouraging or requiring firms to provide information on gender pay gaps and their environmental impact.
Is implementation possible?
So far this though experiment has established ways of thinking about ‘data extraction’ by analogy to natural resource extraction, and has identified some potential disclosures that could be made by both governments and private actors. It has done so in the context of thinking about sustainable development, and how to protect developing countries from data-exploitation, whilst also supporting them to appropriately and responsibly harness data as a developmental tool. There are some rough edges in all this: but also, I would argue, some quite feasible proposals too (disclosure of data-related contracts for example).
Large scale implementation would, of course, need careful design. The market structure, capital requirements and scale of digital and data firms is quite different to that of the natural resource industry. Compliance costs of any disclosure regime would need to be low enough to ensure that it is not only the biggest firms that can engage. Developing country governments also often have limited capacity when it comes to information management. Yet, most of the disclosures envisaged above relate to transactions that, if ‘born digital’, should be fairly easy to publish data on. And where additional machine-readable data (e.g. on laws and policies) is requested, if standards are designed well, there could be a win-win for firms and governments – for example, by allowing firms to more easily identify and select cloud providers that allow them to comply with the regulatory requirements of a particular country.
The political dimensions of implementation are, of course, another story – and one I’ll leave out of this thought experiment for now.
But why? What could the impact be?
Now we come to the real question. Even if we could create a ‘data extraction transparency initiative’, could it have any meaningful developmental impacts?
Here’s where some of the impacts could lie:
If firms had to report more clearly on the amount of ‘data’ they are taking out of a country, and the revenue that gives rise to, governments could tailor licensing and taxation regimes to promote more developmental uses of data. Firms would also be encouraged think about how they are investing in value-generation in countries where they operate.
If contracts that involve data extraction are made public, terms that promote development can be encouraged, and those that diminish the opportunity to national development can be challenged.
If a country government chooses to engage in forms of ‘digital protectionism’, or to impose ‘local content requirements’ on the development of data technologies that could bring long-term benefits, but risk creating a short-term hit on the quality of digital services available in a country, greater transparency could support better policy debate. (Noting, however, that recent years have shown us that politics often trumps rational policy making in the real world).
There will inevitably be readers who see the thrust of this thought experiment as fundamentally anti-market, and who are fearful of, or ideologically opposed, to any of the kinds of government intervention that increasing transparency around data extraction might bring. It can be hard to imagine a digital future not dominated by the ever-increased rise of a small number of digital monopolies. But, from a sustainable development point of view, allowing another path to be sought: which supports to creation of resilient domestic technology industries, which prices in positive and negative externalities from data extraction, and which therefore allows active choices to be made about how national data resources are used as common asset, may be no bad thing.
Over the last 18 months we’ve worked with 66 fantastic authors, and many other contributors, reviewers and editorial board members, to pull together a review of the last decade of activity on open data. The resulting collection provides short essays that look at open data in different sectors, fromaccountability and anti-corruption, to the environment, land ownership and international aid, as well as touching on cross-cutting issues, differentstakeholder perspectives, and regional experiences. We’ve tried to distill key insights in overall and section introductions, and to draw out some emerging messages in an overall conclusion.
This has been my first experience pulling together a whole book, and I’m incredibly grateful to my co-editors, Steve Walker, Mor Rubinstein, and Fernando Perini, who have worked tirelessly over the project to bring together all these contributions, make sure the project is community driven, and to present a professional final book to the world, particularly in what has been a tricky year personally. The team at our co-publishers, African Mindsand IDRC (Simon, Leith, Francois and Nola) also deserve a great debt of thanks for their attention to detail and design.
I’ll ty and write up some reflections and learning points on the book process in the near future, and will be blogging more about specific elements of the research in the coming weeks, but for now, let me share the schedule of upcoming events in case any blog readers happen to be able to join. I’ll aim to update these with links to any outcomes from the sessions too later.
Roundtable at the Harvard Berkman Klein Center, with chapter authors David Eaves, Mariel Garcia Montes, Nagla Rizk, and response from Luminate’s Laura Bacon.
I’ll be connecting via hangouts to explore the connections between data literacy, artificial intelligence, and private sector engagement with open data
A panel discussion as part of the World Bank Let’s Talk Data series, exploring the development of open data over the last decade. This session will also be webcast – see detail in EventBrite.
We’ll be bringing together authors from lots of different chapters, including Shaida Baidee (National Statistics), Catherine Weaver (Development Assistance & Humanitarian Action), Jorge Florez (Anti-corruption), Alexander Howard (Journalists and the Media), Joel Gurin (Private Sector), Christopher Wilson (Civil Society) and Anders Pedersen (Extractives) to talk about their key findings in an informal world cafe style.
I’m joining Tariq Khokhar, Managing Director & Chief Data Scientist, Innovation, The Rockefeller Foundation, Adrienne Schmoeker, Deputy Chief Analytics Officer, City of New York and Beth Simone Noveck, Professor and Director, The GovLab, NYU Tandon (and also foreword writer for the book), to discuss changing approaches to data sharing, and how open data remains relevant.