[Summary: Fragments of reflection on the Decarbonisation and Decolonisation of AI]
I’ve spent some time this morning reading the ‘AI Decolonial Manyfesto’ which opens framed as “a question, an opening, a dance about a future of AI technologies that is decolonial”. Drawing on the insights, positions and perspectives of a fantastic collective authorship, it provides some powerful challenges for thinking about how to shape the future applications of AI (and wider data) technologies.
As I’ve been reading the Manyfesto on Decolonialisation in a short break from working on a project about Decabonisation – and the use of data and AI to mitigate and adapt to the pressing risks of climate breakdown, I find myself particularly reflecting on two lines:
“We do not seek consensus: we value human difference. We reject the idea that any one framework could rule globally.”
and
“Decolonial governance will recognize, in a way that Western-centric governance structures historically have not, how our destinies are intertwined. We owe each other our mutual futures.”
Discussions over the role of data in addressing the global climate crisis may veer towards proposing vast centralising data (and AI) frameworks (or infrastructures), in order to monitor, measure and manage low-carbon transitions. Yet – such centralising data infrastructures risk becoming part of systems that perpetuates historical marginalisation, rather than tools to address systemic injustice: and they risk further sidelining important other forms of knowledge that may be essential to navigate our shared future on a changing planet.
I’m drawn to thinking about the question of ‘minimum shared frameworks’ that may be needed both in national and global contexts to address the particular global challenge of the climate in which all our destines are intertwined. Yet, whilst I can imagine decentralised, (even decolonised?), systems of data capture, sharing and use in order to help accelerate a low-carbon transitions, I’m struggling at first-look to see how those might be brought into being at the pace required by the climate crisis.
Perhaps my focus for that should be on later lines of the Manyfesto:
“We seek to center the engineering, design, knowledge-production, and dispute-resolution practices of diverse cultures, which are embedded with their own value systems.”
My own cultural context, social role, academic training and temperament leaves me profoundly uncomfortable ending a piece of writing without a conclusion – even if a conclusion would be premature (one of the particular structures of the ‘Western male, white’ thought that perhaps does much harm). But, I suspect that here I need to simply take first steps into the dance, and to be more attuned to the way it flows…
[Summary: I’m trying to post a bit more critical reflection on things I read, and to write up more of my learning in shared space. I’ve been exploring why that’s been feeling difficult of late.]
Reading, blogging and engaging through social media used to be a fairly central part of my reflective learning practice. In recent years, my reading, note-taking and posting practices have become quite frayed. Although many times I get as far as a draft post or tweet thread of reflections, I’m often hit by a posting-paralysis – and I stop short both of engaging in open conversation, and solidifying my own reflections through a public post. As I return to a mix of freelance facilitation, research and project work (more on that soon), I’m keen to recover an open learning practice that makes effective use of online spaces
Inspired by Lloyd Davis’ explorations in ‘learning how to work out loud again’(appropriately so, since Lloyd’s earlier community convening and event hosting was a big influence on much of my earlier practice), I’m taking a bit of time in my first few days weeks back at work to identify what I want from a reflective learning practice, to try and examine the barriers I’ve been encountering, and to prototype the tools, processes and principles that might help me recapture some of the thinking space that, at it’s best, the online realm can still (I hope) provide.
Why post anyway?
The caption of David Eaves’ blog comes to mind: “if writing is a muscle, this is my gym”. And linked: writing is a tool of thought. So, if I want to think properly about the things I’m reading and engaging with, I need to be writing about them. And writing a blog post, or constructing a tweet thread, can be a very effective way to push that writing (and thinking) beyond rough bullet points, to more complete thoughts. Such posts often work well as external memory: more than once I’ve searched for an idea, and come upon a blog post I wrote about it many years ago – rediscovering content I might not have found had it been buried in a personal notebook. (It turns out comments from spam bots are also a good ‘random-access-memory-prompt’ on a wordpress blog.)
I’ve also long been influenced by my colleague Bill Badham’s commitment to shared learning. My work often affords me the privilege to read, research and reflect – and there’s something of an obligation to openly share the learning that arises. On a related note, I’m heavily influenced by notions of open academic debate, where there’s a culture (albeit not uncomplicated) of raising questions or challenging data, assumptions and conclusions in the interest of getting to better answers.
So what’s stopping you?
At risk of harking back to a golden age of RSS and blogging, that died along with Google Reader, I suspect I need to consciously adapt my practices to a changed landscape.
Online platforms have changed. I felt most fluent in a time of independent bloggers, slowly reading and responding to each other over a matter of days and weeks. Today, I discover most content via Tweets rather than RSS, and conversations appear to have a much shorter half-life, often fragmenting off into walled garden spaces, of fizzling out half completed as they get lost between different timezones. I’m reluctant to join discussions on walled garden platforms like Facebook, and often find it hard to form thoughts adequately in tweet length.
My networks have changed. At the macro level, online spaces (and public discourse more generally) feels more polarised and quick to anger: although I only find this when I voyage outside the relatively civil filter bubble of online I seem to have built. On the upside, I feel as thought the people I’m surrounded with online are more global, and more diverse (in part, from a conscious effort to seek more gender balance and diversity in who I follow): but on the flip-side, I’m acutely aware that when I write I can’t assume I’m writing into a common culture, or that what I intend as friendly constructive critique will be read as such. Linked to this:
I’m more aware of unintended consequences of a careless post. In particular, I’m aware that, as a cis white male online, I don’t experience even half of the background aggression, abuse, gaslighting or general frustration that many professional women, people of colour, or people from minority communities may encounter daily. What, for me, might be a quick comment on something I’ve read, could come across to others as ‘yet another’ critical comment rather than the ‘Yes, and’I meant it to be.
There are lots of subtleties to navigate around when an @ mention might be seen as a hat-tip credit, vs. when it might be an unwelcome interruption.
My role has changedI still generally think of myself as a learner and junior practitioner, just trying to think out loud. But I’ve become aware from a couple of experiences that sometimes people take what I write more seriously! And that can be a little bit scary, or can place a different pressure on what I’m writing. Am I writing for my own process of thinking? Writing for others? Or writing for impact? Will my critical commentary be taken as having a weight I did not intend? And at the times when I do intend to write in order to influence, rather than just offer a viewpoint, do I need different practices?
My capacity, and focus, has changedThe pandemic and parenthood have squeezed out many of the time-slots I used to use for reflective writing: the train back from London, the early evening and so-on. I’m trying to keep social media engagement to my working hours too, to avoid distractions and disruption during time with family.
Over editingA lot of the work I’ve done over recent years has involved editing text from others, and it’s made me less comfortable with the flow-of-writing, overly subclaused, and less-than-perfectly-clear sentences I’m prone to blogging with. (Though I can still resist that inner editor, as this mess of a paragraph attests: I am writing mainly for my own thinking after all.)
So what do I do about it?
Well – I’m certainly not over posting paralysis: this post has been sitting in draft for a week now. But in the process of putting it together I’ve been exploring a few things:
A more conscious reading practice
Improving my note-taking tools
Linking blogging and social media use
Not putting too much pressure on public posting
I’ve brought scattered notes from the last few years together into a tiddlywiki instance, and have started trying to keep a daily journal there for ad-hoc notes from articles or papers I’m reading – worrying less about perfect curation of notes, and more about just capturing reflections as they arise. I’ve reset my feed reader, and bookmarking tools to better manage a reading list, and am trying to think more carefully about the time to give to reading different things.
I’ve also tried getting back to a blog-post format for responding to things I’m reading, rather than trying twitter threads, which, whilst they might have a more immediate ‘reach’, often feel to me both a bit forced, and demand more immediate follow-up to engage with than my capacity allows.
I was considering setting myself an artificial goal of posting daily or weekly, but for now I’m going to allow a more organic flow of posting, and review in a few weeks to see if developing the diagnosis, and some of the initial steps above, are getting my practice closer to where I want it to be.
Below I’ve shared a few quick notes in a spirit of open reflection (read mostly as ‘Yes, and…‘ rather than ‘No, but’):
The ladder: Arnstein, Hart and Pathways of Participation
Arnstein’s ladder of participation.RSA ‘Remix’ of Arnstein
The report describes drawing on Sherry Arnstein’s ‘ladder of citizen participation’, but in practice uses an RSA simplification of the ladder into a five-part spectrum that cuts off the critical non-participation layers of Arnstein’s model. In doing this, it removes some of the key critical power of the original ladder as a tool to call out tokenism, and push for organisations to reach the highest appropriate rung that maximises the transfer of power.
I’ve worked with various remixes of Arnstein’s ladder over the years, particularly building on building on Hart’s youth engagement remix) that draws attention to distinction between ‘participant initiated’ vs. ‘organisationally initiated’ decision making. In one remix we put forward with Bill Badham and the NYA Youth Participation Team we set the ladder against the range of methods of participations, and explored the need for any participation architecture to think about the pathways of participation through which individuals grow in their capacity to exercise power over decisions.
It would be great to see further developments of the Ada Lovelace framework consider the mix of participatory methods that are appropriate to certain data use contexts, and how these can be linked together. For example, informing all affected stakeholders about a data use project can be the first rung on the ladder towards a smaller number becoming co-designers, joint decision makers, or evaluators. And to design a meaningful consultation reaching a large proportion of affected stakeholders might require co-design or testing with a smaller group of diverse collaborators first: making sure that questions are framed and explained in legitimate and accessible ways.
Data collection, datasets, and data use
“Well-managed data can support organisations, researchers, governments and corporations to conduct lifesaving health research, reduce environmental harms and produce societal value for individuals and communities. But these benefits are often overshadowed by harms, as current practices in data collection, storage, sharing and use have led to high-profile misuses of personal data, data breaches and sharing scandals.”
It feels to me as though the report falls slightly (though, to be fair, not entirely) into the trap of seeing data as a pre-existing fixed resource, where the main questions to be discussed are who will access a dataset, on what terms and to what end. Yet, data is under constant construction, and in participatory data stewardship there should perhaps be a wider set of questions explicitly on the table such as:
Should this data exist at all?
How can this data be better collected in ways that respect stakeholders needs?
What data is missing that should be here? Are we considering the ‘lost opportunites’ as well as the risks of misuse?
Is this data structured in ways that properly represent the interests of all stakeholders?
Personally, I’m particularly interested in the governance role of data standards and structures, and exploring models to increase diverse participation in shaping these foundational parts of data infrastructure.
Decentering the dataset
The report argues that:
“There are currently few examples of participatory approaches to govern access and use of data…”
yet, I wonder if this comes from looking through a narrow lens for projects that are framed as just about the data. I’d hazard that there are numerous social change and public sector improvement projects have drawn upon data-sharing partnerships – albeit framed in terms of service or community change, rather than data-sharing per-se.
In both understanding existing practice, and thinking about the future of participatory data governance practices, I suspect we need to look at how questions about data use are embedded within wider questions about the kinds of change we are seeking to create. For example, if a project is planning to pool data from multiple organisations to identify ‘at risk families’ and to target interventions, a participatory process should take in both questions of data governance and intervention design – as to treat the data process in issolation of the wider use process makes for a less accessible, and potentially substantially biased, process.
Direct participation vs. representatives
One of the things the matrix of (youth) participation model tries to draw out is the distinction between participatory modalities based on ad-hoc individual involvement where stakeholders participate directly, through to those that involve sustained patterns of engagement, but that often move towards models of representative governance. Knowing whether you are aiming for direct or representative-driven participation is an important part of then answering the question ‘Who to involve?’, and being clear on the kind of structures needed to then support meaningful participation.
Where next?
It’s great to see participatory models of data governance on the agenda of groups like Ada Lovelace – although it also feels like there’s a way still to go to see many decades learning from the participation field better connecting with the kinds of technical decisions that affect so many lives.
Over the last week I’ve had the opportunity to share findings from The State of Open Data: Histories and Horizons in a number of different settings: from academic roundtables, to conference presentations, and discussion panels.
Each has been an opportunity not only to promote the rich open access collection of essays just published, but also a chance to explore the many and varied chapters of the book as the starting point for new conversation about how to take forward an open approach to data in different settings and societies.
In this post I’m going to try and reflect on a couple of themes that have struck me during the week. (Note: These are, at this stage, just my initial and personal reflections, rather than a fully edited take on discussions arising from the book.)
Panel discussion at the GovLab with Tariq Khokhar, Adrienne Schmoeker and Beth Noveck.
Renewing open advocacy in a changed landscape
The timeliness of our look at the Histories and Horizons of open data was underlined on Monday when a tweet from Data.gov announced this week as their 10th anniversary, and the Open Knowledge Foundation, also celebrated their 15th birthday with a return to their old name, a re-focussed mission to address all forms of open knowledge, and an emphasis on creating “a future that is fair, free and open.”As they put it:
”…in 2019, our world has changed dramatically. Large unaccountable technology companies have monopolised the digital age, and an unsustainable concentration of wealth and power has led to stunted growth and lost opportunities. “
going on to say
“we recognise it is time for new rules for this new digital world.”
Not only is this a welcome and timely example of the kind of “thinking politically” we call for in the State of Open Data conclusion, but it chimes with many of the discussions this week, which have focussed as much on the ways in which private sector data should be regulated as they have on opening up government data.
While, in tools like the Open Data Charter’s Open Up Guides, we have been able to articulate a general case for opening up data in a particular sector, and then to enumerate ‘high value’ datasets that efforts should attend to, future work may need to go even deeper into analysing the political economy around individual datasets, and to show how a mix of voluntary data sharing, and hard and soft regulation, can be used to more directly address questions about how power is created, structured and distributed through control of data.
As one attendee at our panel at the Gov Lab put it, right now, open data is still often seen as a “perk not a right”.And although ‘right to data’ advocacy has an important role, it is by linking access to data to other rights (to clean air, to health, to justice etc.) that a more sophisticated conversation can develop around improving openness of systems as well as datasets (a point I believe Adrienne Schmoeker put in summing up a vision for the future).
Policy enables, problems drive
So does a turn towards problem-focussed open data initiatives mean we can put aside work on developing open data policies or readiness assessments? In short, no.
In a lunchtime panel at the World Bank, Anat Lewin offered an insightful reflection on The State of Open Data from a multilateral’s perspective, highlighting the continued importance of developing a ‘whole of government’ approach to open data. This was echoed in Adrienne Schmoeker’s description at The Gov Lab of the steps needed to create a city-wide open data capacity in New York. In short, without readiness assessment and open data policies put in place, initiatives that use open data as a strategic tool are likely to rub up against all sorts of practical implementation challenges.
Where in the past, government open data programmes have often involved going out to find data to release, the increasing presence of data science and data analytics teams in government means the emphasis is shifting onto finding problems to solve. Provided data analytics teams recognise the idea of ‘data as a team sport’, requiring not just technical skills, but also social science, civic engagement and policy development skill sets – and providing professional values of openness are embedded in such teams – then we may be moving towards a model in which ‘vertical’ work on open data policy, works alongside ‘horizontal’ problem-driven initiatives that may make less use of the language of open data, but which still benefit from a framework of openness.
Chapter discussions at the OpenGovHub, Washington DC
Political economy really matters
It’s been really good to see the insights that can be generated by bringing different chapters of the book into conversation. For example, at the Berkman-Klein Centre, comparing and contrasting attitudes in North America vs. North Africa towards the idea that governments might require transport app providers like Uber to share their data with the state, revealed the different layers of concern, from differences in the market structure in each country, to different levels of trust in the state. Or as danah boyd put it in our discussions at Data and Society, “what do you do when the government is part of your threat model?”.This presents interesting challenges for the development of transnational (open) data initiatives and standards – calling for a recognition that the approach that works in one country (or even one city), may not work so well in others. Research still does too little to take into account the particular political and market dynamics that surround successful open data and data analytic projects.
A comparisons across sectors, emerging from our ‘world cafe’ with State of Open Data authors at the OpenGovHub also shows the trade-offs to be made when designing transparency, open data and data sharing initiatives. For example, where the extractives transparency community has the benefit of hard law to mandate certain disclosures, such law is comparatively brittle, and does not always result in the kind of structured data needed to drive analysis. By contrast, open contracting, in relying on a more voluntary and peer-pressure model, may be able to refine it’s technical standards more iteratively, but perhaps at the cost of weaker mechanisms to enforce comprehensive disclosure. As Noel Hidalgo put it, there is a design challenge in making a standard that is a baseline, on top of which more can be shared, rather than one that becomes a ceiling, where governments focus on minimal compliance.
It is also important to recognise that when data has power, many different actors may seek to control, influence and ultimately mess with it. As data systems become more complex, the vectors for attack can increase. In discussions at Data & Society, we briefly touched on one cases where a government institution has had to take considerable steps to correct for external manipulation of it’s network of sensors. When data is used to trigger direct policy response (e.g. weather data triggering insurance payouts, or crime data triggering policing action), then the security and scrutiny of that data becomes even more important.
Open data as a strategic tool for data justice
I heard the question “Is open data dead?” a few times over this week. As the introductory presentation I gave for a few talks noted, we are certainly beyond peak open data hype. But, the jury is, it seems, still very much out on the role that discourses around open data should play in the decade ahead. At our Berkman-Klein Centre roundtable, Laura Bacon shared work by Omidyar/Luminate/Dalberg that offered a set of future scenarios for work on open data, including the continued existence of a distinct open data field, and an alternative future in which open data becomes subsumed within some other agenda such as ‘data rights’. However, as we got into discussions at Data & Society of data on police violence, questions of missing data, and debates about the balancing act to be struck in future between publishing administrative data and protecting privacy, the language of ‘data justice’ (rather than data rights) appeared to offer us the richest framework for thinking about the future.
Data justice is broader than open data, yet open data practices may often be a strategic tool in bringing it about. I’ve been left this week with a sense that we have not done enough to date to document and understand ways of drawing on open data production, consumption and standardisation as a form of strategic intervention. If we had a better language here, better documented patterns, and a stronger evidence base on what works, it might be easier to both choose when to prioritise open data interventions, and to identify when other kinds of interventions in a data ecosystem are more appropriate tools of social progress and justice.
Ultimately, a lot of discussions the book has sparked have been less about open data per-se, and much more about the shape of data infrastructures, and questions of data interoperability.In discussions of Open Data and Artificial Intelligence at the OpenGovHub, we explored the failure of many efforts to develop interoperability within organisations and across organisational boundaries. I believe it was Jed Miller who put the challenge succinctly: to build interoperable systems, you need to “think like an organiser” – recognising data projects also as projects of organisational change and mass collaboration. Although I think we have mostly moved past the era in which civic technologists were walking around with an open data hammer, and seeing every problem as a nail, we have some way to go before we have a full understanding of the open data tools that need to be in everyones toolbox, and those that may still need a specialist.
Reconfiguring measurement to focus on openness of infrastructure
One way to support advocacy for openness, whilst avoiding reifying open data, and integrating learning from the last decade on the need to embed open data practices sector-by-sector, could be found in an updated approach to measurement. David Eaves made the point in our Berkman-Klein Centre roundtable that the number of widely adopted standards, as opposed to the number of data portals or datasets, is a much better indicator of progress.
As resource for monitoring, measuring or benchmarking open data per-se becomes more scarce, there is an opportunity to look at new measurement frames that look at the data infrastructure and ecosystem around a particular problem, and ask about the extent of openness, not only of data, but also of governance. A number of conversations this week have illustrated the value of shifting the discussion onto data infrastructure and interoperability: yet (a) the language of data infrastructure has not yet taken hold, and can be hard to pin down; and (b) there is a risk of openness being downplayed in favour of a focus on centralised data infrastructures. Updating open data measurement tools to look at infrastructures and systems rather than datasets may be one way to intervene in this unfolding space.
[Summary: Over the next few months I’m working with Create Gloucestershire with a brief to catalyse a range of organisational data projects. Amongst these will be a hackathon of sorts, exploring how artists and analysts might collaborate to look at the cultural education sector locally. The body of this post shares some exploratory groundwork. This is a variation cross-posted from the Create Gloucestershire website.]
Create Gloucestershire have been exploring data for a while now, looking to understand what the ever-increasing volume of online forms, data systems and spreadsheets arts organisations encounter every day might mean for the local cultural sector. For my part, I’ve long worked with data-rich projects, focussing on topics from workers co-operatives and youth participation, to international aid and corruption in government contracting, but the cultural sector is a space I’ve not widely explored.
Often, the process of exploring data can feel like a journey into the technical: where data stands in opposition to all things creative. So, as I join CG for the next three months as a ‘digital catalyst’, working on the use of data within the organisation, I wanted to start by stepping back, and exploring the different places at which data, art and creativity meet with an exploratory blog post..
…and a local note on getting involved…
In a few weeks (late February 2019) we’ll be exploring these issues through a short early-evening workshop in Stroud: with a view to hosting a day-long data-&-art hackathon in late Spring. If you would like to find out more, drop me a line.
Post: Art meets data | Data meets art
For some, data and art are diametrically opposed. Data is about facts. Art about feelings.
Take a look at writings from the data visualisation community [1], and you will see some suggest that data art is just bad visualisation. Data visualisation, the argument runs, uses graphical presentation to communicate information concisely and clearly. Data art, by contrast, places beauty before functionality. Aesthetics before information.
Found on Flickr: “I’m not even sure what this chart says … but I think its gorgeous!” (Image CC-BY Carla Gates / Original image source: ZSL)
I prefer to see data, visualisation and art all as components of communication. Communication as the process of sharing information, knowledge and wisdom.
The DIKW pyramid proposes a relationship between Data, Information, Knowledge and Wisdom, in which information involves the representation of data into ‘knowing that’, whilst knowledge requires experience to ‘know how’, and wisdom requires perspective and trained judgement in order to ‘know why’. (Image CC BY-SA. Wikimedia Commons)
Turning data into information requires a process of organisation and contextualisation. For example, a collection of isolated facts may be made more informative when arranged into a table. That table may be made more easily intelligible when summarised through counts and averages. And it may communicate more clearly when visualisation is included.
An Information -> Data -> Information journey. GCSE Results in Arts Subjects. (Screenshots & own analysis)
But when seeking to communicate a message from the data, there is another contextualisation that matters: contextualising to the recipient: to what they already know, or what you may want to them to come to know. Here, the right tools may not only be those of analysis and visualisation, but also those of art: communicating a message shaped by the data, though not entirely composed of it.
Artistic expression could focus on a finding, or a claim from the data, or may seek to support a particular audience to explore, interrogate and draw interpretations from a dataset. (Image CC BY-SA Toby Oxborrow)
In our upcoming workshop, we’ll be taking a number of datasets about the state of cultural education in Gloucestershire, and asking what they tell us. We’ll be thinking about the different ways to make sense of the data, and the ways to communicate messages from it. My hope is that we will find different ways to express the same data, looking at the same topic from a range of different angles, and bringing in other data sources of our own. In that way, we’ll be able to learn together both about practical skills for working with data, and to explore the subjects the data represents.
In preparing for this workshop I’ve been looking at ways different practitioners have connected data and art, through a range of media, over recent years.
The Open Data Institute: Data as Culture
Since it’s inception, The Open Data Institute in London has run a programme called ‘Data as culture’, commissioning artists to respond to the increasing datification of society.
Some works take a relatively direct approach to representation, selecting particular streams of data from the web and using different media to represent them. Text trends, for example, selected and counterposes different google search trends on a simple graph over time. And the ODIs infamous vending machine provides free crisps in response to news media mentions of recession.
In representative works, the artist has chosen the signal to focus on, and the context in which it is presented. However, the underlying data remains more or less legible, and depending on the contextual media and the literacies of the ‘reader’, certain factual information can also be extracted from the artwork. Whilst it might be more time-consuming to read, the effort demanded by both the act of creation, and the act of reading, may invite a deeper engagement with the phenomena described by the data. London EC2 explores this idea of changing the message through changing the media: by woodblock printing twitter messages, thus slowing down the pace of social media, encouraging the viewer to rethink otherwise ephemeral information.
In other works that are directly driven by datasets, data is used more to convey an impression rather than to convey specific information. In the knitted Punchcard Economy banners, a representation working hours is combined with a pre-defined message resulting in data that can be read as texture, more than it can be read as pattern. In choosing how far to ‘arrange’ the data, the work finds its place on a spectrum between visualisation or aesthetic organisation.
Punchcard Economy, Sam Meech, 2013. ODI: 3.5 x 0.5m knitted banner, FutureEverything: 5 x 3m knitted banner & knitting machines.
Other works in the data as culture collection start not from datasets, but from artists responses to wider trends of datification. Works such as metography, flipped clock and horizon respond to forms of data and it’s presentation in the modern world, raising questions about data and representation – but not necessarily about the specific data which happens to form part of the work.
Other works still, look for the data within art, such as pixelquipu which takes it’s structure from pre-Columbian quipu (necklace-shaped, knotted threads from the Inca empire, that are thought to contain information relating to calendars and accounting in the empire). In these cases, turning information into data, and then representing it back in other way, is used to explore patterns that might not have otherwise been visible.
YoHa: Invisible Airs
Although it has also featured in the ODI’s Data as Culture collection, I want to draw out and look specifically at YoHa’s ‘Invisible Airs’ project. Not least because it was the first real work of ‘open data art’ I encountered, stumbling across it at an event in Bristol.
As newly released public spending records appear on screen, a pneumatically powered knife stabs a library book, sending a message about budget cuts, and inviting scrutiny of the data on screen.
It is a hard project to describe, but fortunately YoHa have a detailed project description and video on their website, showing the contraptions (participatory kinetic sculptures?) they created in 2014, driven by pneumatic tubes and actuated by information from Bristol City Council’s database of public spending.
In the video, Graham Harwood describes how their different creations (from a bike seat that rises up in response to spending transactions, to a pneumatic knife stabbing a book to highlight library service cuts) seek to ‘de-normalise’ data, not in the database designers sense of finding a suitable level of data abstraction, but in the sense of engaging the participant to understand otherwise dry data in new ways. The learning from the project is also instructive: in terms of exploring how far the works kept the attention of those engaging with them, or how far they were able to communicate only a conceptual point, before viewers attention fell away, and messages from the underlying data were lost.
Ultimately though, Invisible Airs (and other YoHa works engaging with the theme of data) are not so much communicating data, as communicating again about the role, and power, of data in our society. Their work seeks to bring databases, rather than the individual data items they contain, into view. As project commissioner Prof Jon Dovey puts it, “If you are interested in the way that power works, if you are interested in the way that local government works, if you are interested in the way that corporations work, if you are interested in the way that the state works, then data is at the heart of it…. The way your council tax gets calculated… the way your education budget gets calculated, all these things function through databases.”
Everyday data arts
Data as art need not involve costly commissions. For example, the media recently picked up on the story of a german commuter who had knitted a ‘train-delay scarf’, with choice of wool and colour representing length of delays. The act of creating was both a means to record, and to communicate, and in the process communicate much more effectively than the same data might have done if simply recorded in a spreadsheet, or even placed onto a chart with data visualisation.
‘Train Delay Scarf’ – a twitter sensation in January 2019.
Data sculpture and data-driven music
In a 2011 TED Talk, Nathalie Miebach has explored both how weather data can be turned into a work of art through sculpture and music, as well as questioning how the setting in which the resulting work is show affects how it is perceived.
She describes the creation of a vocabulary for turning the data into a creative work, but also the choice of a media that is not entirely controlled by the data, such that the resulting work is not entirely determined by the data, but also by its interaction with other environmental factors.
Dance your PhD, and dancing data
When reflecting on data and art, I was reminded of the annual Dance your PhD competition. Although the focus is more on expressing algorithms and research findings, than underlying datasets, it offers a useful way to reflect on ways to explain data, not only express what it contains.
In a similar vein, AlgoRythmics explain sorting algorithms using folk dance – a playful way of explaining what’s going on inside the machine when processing data.
There is an interesting distinction though between these two. Whilst Dance your PhD entries generally ‘annotate’ the dance with text to explain the phenomena that the dance engages with audience with, in AlgoRythmics, the dance itself is the entirety of the explanation.
Visualisation
The fields of InfoViz and DataViz have exploded over the last decade. Blog such as InformationIsBeautiful,Flowing Data and Visualising Data provide a regular dose of new maps, charts and novel presentation of data. However, InfoViz and DataViz are not simply synonyms: they represent work that starts from different points of a Data/Information/Knowledge model, and with often different goals in mind.
Take, for example, David McCandless’ work in the ‘Information in Beautiful’ book (also presented in this TED Talk). The images, although often based on data, are not a direct visualisation of the data, but an editorialised story. The data has already been analysed to identify a message before it is presented through charts, maps and diagrams.
By contrast, in Edward Tufte’s work on data visualisation, or even statistical graphics, the role of visualisation is to present data in order to support the analytical process and the discovery of information. Tufte talks of ‘the thinking eye’, highlighting the way in which patterns that may be invisible when data is presented numerically, can become visible and intelligible when the right visual representation is chosen. However, for Tufte, the idea of the correct approach to visualisation is important: presenting data effectively is both an art and a technical skill, informed by insights and research from art and design, but fundamentally something that can be done right, or done wrong.
Other data visualisation falls somewhere between the extremes I’ve painted here. Exploratory data visualisations can seek to both support analysis, but also to tell a particular story through their selection of visualisation approach. A look at the winners of the recent 360 Giving Data Visualisation Challenge illustrates this well. Each of these visualisation draws on the same open dataset about grant making, but where ‘A drop in the bucket’ uses a playful animation to highlight the size of grants from different funders, Funding Themes extracts topics from the data and presents an interactive visualisation, inviting users to ‘drill down’ into the data and explore it in more depth. Others, like trend engine use more of a dashboard approach to present data, allowing the user to skim through and find, if not complete answers, at least refined questions that they may want to ask of the raw dataset.
Funding Trends for a ‘cluster’ of arts-related grants, drawing on 360 Giving data. Creator: Xavi Gimenez
Arts meet data | Data meet arts | Brokering introductions
Writing this post has given me a starting point to explore some data-art-dichotomies and to survey and link to a range of shared examples that might be useful for conversations in the coming weeks.
It’s also sparked some ideas for workshop methods we might be able to use to keep analytical, interpretative and communicative modes in mind when planning for a hackathon later this year. But that will have to wait for a future post…
Footnotes
[1]: I am overstating the argument in the blog post on art and data visualisation slightly for effect. The post, and comments in fact offer a nuanced dialogue worth exploring on the relationship of data visualisation and art, although still seeking to draw a clear disjunct relationship.
At it’s heart, open contracting is a simple idea: whenever public money and resources are at stake through a contracting processes, transparency and participation should be the norm.
Yet, as the Open Contracting Global Summit (#ocglobal17) in Amsterdam this week has demonstrated, it’s also an idea that brings together a very wide community. Reflecting on conversations from the week, I’ve tried here to capture five key reflections on where we are at, and where we might be heading:
(1) It’s not just procurement
Although the open contracting emphasis is often on the way governments buy goods and services, there are many other contracts where public resources are at stake: from licenses and concessions, to Public Private Partnership deals and grant agreements.
These each have different dynamics, and different approaches might be needed to open up each kind of process.
The Open Contracting Data Standard (OCDS) is primarily designed around procurement processes, although at OCGlobal we gave the first public preview of the OCDS for PPPs profile, that extends the OCDS data model to provide a structured way of recording in-depth disclosures for Public Private Partnership deals.
(2) It’s not just JSON
Thanks to Article 19, the corridoors at OCGlobal had been turned into a ‘gallery of redaction’. Copies of contracting documents obtained through FOI requests provided tantalising hints of government and private sector deals: yet with all the key facts blacked out. These stood as a reminder of how many times the public are kept in the dark over contracts
Neither documents, nor data, on their own will answer all the question citizens or companies might have about contracting. Not will they automatically spark the kinds of participation, scrutiny and engagement that are the essential complement of transparency.
Any other approach risks making the perfect into the enemy of the good: preventing publication until data is perfect.
The challenge ahead is in designing and refining the incentive structures that make sure open contracting efforts do not stop at getting a few documents online, or some fields in a JSON dataset – but instead that over time they broadens and deepen both disclosure, and effective use of the information that has been made available.
(3) It’s an iterative journey
There’s a much refreshed implementation section on the Open Contracting website, curating a range of guidance and tools to help put open contracting ideas into practice. The framing of a linear ‘seven steps’ journey towards open contracting is replaced with a ‘hopscotch’ presentation of the steps involved: with interlocking cycles of development and use.
This feels much closer to the reality I’ve experienced supporting open contracting implementations, which involve a dance back and forward between a vision for disclosure, and the reality of getting data and documents published from legacy systems, transparency features added to systems that are in development, or policies and practice changed to support greater citizen engagement in the contracting process.
There was a lot of talk at OC Global about e-procurement systems as the ideal source of open contracting data: yet for many countries, effective e-procurement deployments are a long way off, and so it’s important to keep in mind different ways tools like OCDS can be used:
Based-on – OCDS can provide a guide for reviewing and reflecting on current levels of disclosure, and for turning unstructured information into data to analyse. This is the approach pioneered by projects like Budeshi, who started out transcribing documents to data to demonstrate the value that a more data-driven approach could have to procurement monitoring.
Bolt-on – OCDS can be used as the target format when exporting data from existing contracting data systems. These might be reporting systems that capture regular monitoring returns on the contracting process, or transactional systems through which procurement is run. Here, the process of mapping existing data to OCDS can often reveal data quality issues in the source systems – and with the right feedback loops, this can lead to not only data publication, but also changes to improve data in future.
Built-in – OCDS can be used to inform the design of new systems – providing common shared data models, and a community where extended modelling of data can be discussed. However, it’s important to remember that building new systems is not just about data structures – it’s also about user experience, and right now, the OCDS doesn’t address this.
To my mind, OCDS provide a structured framework that should support use in all these different ways. As we iterate on the standard itself, it’s important we don’t undermine this flexibility – but that instead we use it to establish common ground on which publishers and users can debate issues of data quality. With the standard, those debates should be actionable: but it’s not up the standard itself to settle them.
(4) Contracting is core: but it doesn’t start or end there
Contracting is just one of the government processes that affects how resources are allocated and used. Before contracting starts, budgets are often set, or wide-reaching procurement plans established. During contract implementation, payment processes kick-in. And for the private companies involved in public contracts, there are all sorts of interlocking processes of registration, financing and taxation.
From an architectural perspective it’s important for us to understand the boundaries of the open contracting process, and how it can link up with other processes. For example, whilst OCDS can capture budget information as part of a contracting process (e.g. the amount of budget allocated to that process), it starts stretching the data model to represent a budget process nested within a contracting process.
As one of the break-out groups looking at budget, contract and spend integration noted, the key to joining up data is not putting everything in the same dataset or system, but comes from establishing business processes that ensure common identifiers are used to join up the systems that manage parallel processes.
There’s a lot of work to do before we have easy interoperability between different parts of an overall [accountability architecture](ACSP LINK LINK LINK) – but the biggest issues are of data production and use, rather than of standards and schemas.
(5) It’s time to tidy our terminology
The open contracting community is broad, and, as I recently wrote over here, “the word ‘standard’ means different things to different people.”. So does contracting. And tender. And validation. And assessment. And so-on.
Following recent workshops in London and Argentina, the OCDS team have been thinking a lot about how we tighten up our use of key terms and concepts, establishing a set of draft translation principles and policies, and we’ve been reflecting more on how to also be clearer on ideas like data validity, quality and feedback.
But we also have to recognise that debates over language are laden with power dynamics: and specialist language can be used to impose or exclude. Open contracting should not be about dumbing down complex processes of contracting, but nor should it be able requiring every citizen to learn procurement-speak. Again, for OCDS and other tools designed to support open contracting, we have balancing act: creating boundary objects that help different communities meet in the middle.
The first step towards this is just working out how we’re using words at the moment: checking on current practice, before working out how we can improve.
Gratitude
Asides from sparking a wealth of learning, the other thing an event like #OCGlobal17 does is remind me just how fortunate I am to get to work with such a inspiring network of people: exploring challenging issues with a great collaborative spirit. Thanks all!
The reflections above are more or less fragmentary, and I’m looking forward to working with many of the folk in the picture below to see where the journey takes us next.
[Summary: Thinking aloud about a pragmatic / humanist approach to data infrastructure building]
Stephen Abbott Pugh of Open Knowledge International has just blogged about the Open Data for Tax Justice ‘design sprint’ that took place in London on Monday and Tuesday. I took part in the first day and a half of the workshop, and found myself fairly at-odds with the approach being taken that focussed narrowly on the data-pipelines based creation of a centralised dataset, and that appeared to create barriers rather than bridges between data and domain experts. Rather than the rethink the approach, as I would argue is needed, the Open Knowledge write up appears to show the Open Data for Tax Justice project heading further down this flawed path.
In this post, I’m offering an (I hope) constructive critique of the approach, trying to draw out some more general principles that might inform projects to create more participatory data infrastructures.
The context
As the OKI post relates:
“Country-by-country reporting (CBCR) is a transparency mechanism which requires multinational corporations to publish information about their economic activities in all of the countries where they operate. This includes information on the taxes they pay, the number of people they employ and the profits they report.”
This week’s design sprint focussed particularly on ‘data extraction’, developing a set of data pipeline scripts and processes that involve downloading a report PDF, marking up the tables where Country by Country data is stored, describing what each column contains using YAML, and then committing this to GitHub where the process can then be replicably run using datapipeline commands. Then, with the data extracted, it can be loaded into an SQL database, and explored by writing queries or building simple charts. It’s a technically advanced approach, and great for ensuring replicability of data extraction.
But, its also an approach that ultimately entirely misses the point, ignoring the social process of data production, creating technical barriers instead of empowering contributors and users, and offering nothing for campaigners who want to ensure that better data is produced ‘at source’ by companies.
Whilst the OKI blog post reports that “The Open Data for Tax Justice network team are now exploring opportunities for collaborations to collect and process all available CRD IV data via the pipeline and tools developed during our sprint.” I want to argue for a refocussed approach, based around a much closer look at the social dynamics of data creation and use.
An alternative approach: crafting collaborations
I’ve tried below to unpack a number of principles that might guide that alternative approach:
Principle 1: Letting people use their own tools
Any approach that involves downloading, installing, signing-up to, configuring or learning new software in order to create or use data is likely to exclude a large community of potential users. If the data you are dealing with is tabular: focus on spreadsheets.
More technical users can transform data into database formats when the questions they want to answer require the additional power that brings, but it is better if the starting workflow is configured to be accessible to the largest number of likely users.
Back in October I put together a rough prototype of a Google spreadsheets based transcription tool for Country by Country reports, that needed just copy-and-paste of data, and a few selections from validated drop-down lists to go from PDFs to normalised data – allowing a large user community to engage directly with the data, with almost zero learning curve.
The only tool this approach needs to introduce is something like tabula or PDFTables to convert from PDF to Excel or CSV: but in this workflow the data comes right back to the user to be able to work with it after it has been converted, rather than being taken away from them into a longer processing pipeline. Plus, it brings the benefit of raising awareness of data extraction from PDF that the user can adopt for other projects in future, and allowing the user to work-around failed conversions using a manual transcription approach if they need to.
(Sidenote: from discussions, I understand that one of the reasons the OKI team made their technical choice was from envisaging the primary users as ‘non-experts’ who would engage in crowdsourcing transcriptions of PDF reports. I think this is both highly optimistic, and relies on a flawed analysis of the relatively small scale of the crowdsourcing task in terms of a few 1000 reports a year, and the potential benefits of involving a more engaged group of contributors in creating a civil society database)
Principle 2: Aim for instant empowerment
One of the striking things about Country by Country reporting data is how simple it ultimately is. The CRD IV disclosures contain just a handful of measures (turnover, pre-tax profits, tax paid, number of employees), a few dimensions (company name, country, year), and a range of annotations in footnotes or explanations. The analysis that can be done with this is data is similarly simple – yet also very powerful. Being able to go from a PDF table of data, to a quick view of the ratios between turnover and tax, or profit and employees for a country can quickly highlight areas to investigate for profit-shifting and tax-avoidance behaviour.
Calculating these ratios is possible almost as soon as you have data in a spreadsheet form. In fact, a well set up template could calculate them directly, or the user with basic ability to write formula could fill in the columns they need.
Many of the use-cases for Country by Country reports are based not on aggregation across hundreds of firms, but on simply understanding the behaviour of one or two firms. Investigators and researchers often have firms they are particularly interested in, and where the combination of simple data, and their contextual knowledge, can go a long way.
Principle 3: Don’t drop context
On the topic of context: all those footnotes and explanations in company reports are an important part of the data. They might not be computable, or easy to query against, but in the data explorations that took place on Monday and Tuesday I was struck by how much the tax justice experts were relying not only on the numerical figures to find stories, but also on the explanations and other annotations from reports.
The data pipelines approach dropped these annotations (and indeed dropped anything that didn’t fit into it’s schema). An alternative approach would work from the principle that, as far as possible, nothing of the source should be thrown away – and structure should be layered on top of the messy reality of accounting judgements and decisions.
Principle 4: Data making is meaning-making
A lot of the analysis of Country by Country reporting data is about look for outliers. But data outliers and data errors can look pretty similar. Instead of trying to separate the process of data preparation and analysis, these two need to be brought closer together.
Creating a shared database of tax disclosures will involve not only processes of data extraction, but also processes of validation and quality control. It will require incentives for contributors, and will require attention to building a community of users.
Some of the current structured data available from Country by Country reports has been transcribed by University students as part of their classes – where data was created as a starting point for a close feedback loop of data analysis. The idea of ‘frictionless data’ makes sense when it comes to getting a list of currency codes, but when it comes to understanding accounts, some ‘friction’ of social process can go a long way to getting reliable data, and building a community of practice who understand the data in more depth.
Principle 5: Standards support distributed collaboration
One of the difficulties in using the data mentioned above, prepared by a group of students, was that it had been transcribed and structured to solve the particular analytical problem of the class, and not against any shared standard for identifying countries, companies or the measures being transcribed.
The absence of agreement on key issues such as codelists for tax jurisdictions, company identifiers, codes and definitions of measures, and how to handle annotations and missing data means that the data that is generated by different researchers, or even different regulatory regimes, is not comparable, and can’t be easily combined.
The data pipelines approach is based on rendering data comparable through a centralised infrastructure. In my experience, such approaches are brittle, particularly in the context of voluntary collaboration, and they tend to create bottlenecks for data sharing and innovation. By contrast, an approach based on building light-weight standards can support a much more distributed collaboration approach – in which different groups can focus first on the data that is of most interest to them (for example, national journalists focussing on the tax record of the top-10 companies in their jurisdiction), easily contributing data to a common pool later when their incentives are aligned.
Depending on your viewpoint, the approach I’ve started to set out above might look more technically ‘messy’ – but I would argue it is more in-tune with the social realities of building a collaborative dataset of company tax disclosures.
Fundamentally (with the exception perhaps of standard maintenance, although that should be managed as a multi-stakeholder project long-term) – it is much more decentralised. This is in line with the approach in the Open Contracting Data Standard, where the Open Contracting Partnership have stuck well to their field-building aspirations, and where many of the most interesting data projects emerge organically at the edge of the network, only later feeding into cross-collaboration.
Even then, this sketch of an alternative technical approach above is only part of the story in building a better data-foundation for action to address corporate tax avoidance. There will still be a lot of labour to create incentives, encourage co-operation, manage data quality, and build capacity to work with data. But better we engage with that labour, than spending our efforts chasing after frictionless dreams of easily created perfect datasets.
[Summary: Exploring the social and technical dynamics of aid traceability: let’s learn what we can from distributed ledgers, without thinking that all the solutions are to be found in the blockchain.]
My colleagues at Open Data Services are working at the moment on a project for UN Habitat around traceability of aid flows. With an increasing number of organisations publishing data using the International Aid Transparency Initiative data standard, and increasing amounts of government contracting and spending data available online, the theory is that it should be possible to track funding flows.
In this blog post I’ll try and think aloud about some of the opportunities and challenges for traceability.
Why follow funds?
I can envisage a number of hypothetical use cases traceability of aid.
Firstly, donors want to be able to understand where their money has gone. This is important for at least three reasons:
Effectiveness & impact: knowing which projects and programmes have been the most effective;
Understanding and communication: being able to see more information about the projects funded, and to present information on projects and their impacts to the public to build support for development;
Addressing fraud and corruption: identifying leakage and mis-use of funds.
Traceability is important because the relationship between donor and delivery is often indirect. A grant may pass through a number of intermediary organisations before it reaches the ultimately beneficiaries. For example, a country donor may fund a multi-lateral fund, which in turn commissions an international organisation to deliver a programme, and they in turn contract with country partners, who in turn buy in provision from local providers.
Secondly, communities where projects are funded, or where funds should have been receieved, may want to trace funding upwards: understanding the actors and policy agendas affecting their communities, and identifying when funds they are entitled to have not arrived (see the investigative work of Follow The Money Nigeria for a good example of this latter use case).
Short-circuiting social systems
It is important to consider the ways in which work on the traceability of funds potentially bypasses, ‘routes around’ or disrupts* (*choose your own framing) existing funding and reporting relationships – allowing donors or communities to reach beyond intermediaries to exert such authority and power over outcomes as they can exercise.
Take the example given above. We can represent the funding flows in a diagram as below:
But there are more than one-way-flows going on here. Most of the parties involved will have some sort of reporting responsibility to those giving them funds, and so we also have a report
By the time reporting gets to the donor, it is unlikely to include much detail on the work of the local partners or providers (indeed, the multilateral, for example, may not report specifically on this project, just on the development co-operation in general). The INGO may even have very limited information about what happens just a few steps down the chain on the ground, having to trust intermediary reports.
In cases where there isn’t complete trust in this network of reporting, and clear mechanisms to ensure each party is excercising it’s responsibility to ensure the most effective, and corruption-free, use of resources by the next party down, the case for being able to see through this chain, tracing funds and having direct ability to assess impacts and risks is clearly desirable.
Yet – it also needs to be approached carefully. Each of the relationships in this funding chain is about more than just passing on some clearly defined packet of money. Each party may bring specific contextual knowledge, skills and experience. Enabling those at the top of a funding chain to leap over intermediaries doesn’t inevitably having a positive impact: particularly given what the history of development co-operative has to teach about how power dynamics and the imposition of top-down solutions can lead to substantial harms.
None of this is a case against traceability – but it is a call for consideration of the social dynamics of traceability infrastructures – and considering of how to ensure contextual knowledge is kept accessible when it becomes possible to traverse the links of a funding chain.
The co-ordination challenge of traceability
Right now, the IATI data standard has support for traceability at the project and transaction level.
At the project level the related-activity field can be used to indicate parent, child and co-funded activities.
At the transaction level, data on incoming funds can specify the activity-id used by the upstream organisation to identify the project the funds come from, and data on outgoing funds can specify the activity-id used by the downstream organisation.
This supports both upwards and downwards linking (e.g. a funder can publish the identified of the funded project, or a receipient can publish the identifier of the donor project that is providing funds), but is based on explicit co-ordination and the capture of additional data.
As a distributed approach to the publication of open data, there are no consistency checks in IATI to ensure that providers and recipients agree on identifiers, and often there can be practical challenges to capture this data, not least that:
A) Many of the accounting systems in which transaction data is captured have no fields for upstream or downstream project identifier, nor any way of conceptually linking transactions to these externally defined projects;
B) Some parties in the funding chain may not publish IATI data, or may do so in forms that do not support traceability, breaking the chain;
C) The identifier of a downstream project may not be created at the time an upstream project assigns funds – exchanging identifiers can create a substantial administrative burden;
At the last IATI TAG meeting in Ottawa, this led to some discussion of other technologies that might be explored to address issues of traceability.
Technical utopias and practical traceability
Let’s start with a number of assorted observations:
UPS can track a package right around the world, giving me regular updates on where it is. The package has a barcode on, and is being transferred by a single company.
I can make a faster-payments bank transfer in the UK with a reference number that appears in both my bank statements, and the receipients statements, travelling between banks in seconds. Banks leverage their trust, and use centralised third-party providers as part of data exchange and reconciling funding transfers.
When making some international transfers, the money has effectively disappeared from view for quite a while, with lots of time spent on the phone to sender, recipient and intermediary banks to track down the funds. Trust, digital systems and reconciliation services function less well across international borders.
Transactions on the BitCoin Blockchain are, to some extent, traceable. BitCoin is a distributed system. (Given any BitCoin ‘address’ it’s possible to go back into the public ledger and see which addresses have transferred an amount of bitcoins there, and to follow the chain onwards. If you can match an address to an identity, the currency, far from being anonymous, is fairly transparent*. This is the reason for BitCoin mixer services, designed to remove the trackability of coins.)
There are reported experiments with using BlockChain technologies in a range of different settings, incuding for land registries.
There’s a lot of investment going into FinTech right now – exploring ways to update financial services
All of this can lead to some excitement about the potential of new technologies to render funding flows traceable. If we can trace parcels and BitCoins, the argument goes, why can’t we have traceability of public funds and development assistance?
Although I think such an argument falls down in a number of key areas (which I’ll get to in a moment), it does point towards a key component missing from the current aid transparency landscape – in the form of a shared ledger.
One of the reasons IATI is based on a distributed data publishing model, without any internal consistency checks between publishers, is prior experience in the sector of submitting data to centralised aid databases. However, peer-to-peer and block-chain like technologies now offer a way to separate out co-ordination and the creation of consensus on the state of the world, from the centralisation of data in a single database.
It is at least theoretically possible to imagine a world in which the data a government publishes about it’s transactions is only considered part of the story, and in which the recipient needs to confirm receipt in a public ledger to complete the transactional record. Transactions ultimately have two parts (sending and receipt), and open (distributed) ledger systems could offer the ability to layer an auditable record on top of the actual transfer of funds.
However (as I said, there are some serious limitations here), such a system is only an account giving of the funding flows, not the flows themself (unlike BitCoin) which still leaves space for corruption through maintaining false information in the ledger. Although trusted financial intermediaries (banks and others) could be brought into the picture, as others responsible for confirming transactions, it’s hard to envisage how adoption of such a system could be brought about over the short and medium term (particularly globally). Secondly, although transactions between organisations might be made more visible and traceable in this way, the transactions inside an organisation remain opaque. Working out which funds relate to which internal and external projects is still a matter of the internal businesses processes in organisations involved in the aid delivery chain.
There may be other traceability systems we should be exploring as inspirations for aid and public money traceable. What my brief look at BitCoin leads me to reflect on is potential role over the short-term of reconciliation services that can, at the very least, report on the extent to which different IATI publisers are mutually confirming each others information. Over the long-term, a move towards more real-time transparency infrastructures, rather than periodic data publication, might open up new opportunities – although with all sorts of associated challenges.
Ultimately – creating traceable aid still requires labour to generate shared conceptual understandings of how particular transactions and projects relate.
How much is enough?
Let’s loop back round. In this post (as in many of the conversations I’ve had about traceable), we started with some use cases for traceability; we saw some of the challenges; we got briefly excited about what new technologies could do to provide traceability; we saw the opportunities, but also the many limitations. Where do we end up then?
I think important is to loop back to our use cases, and to consider how technology can help but not completely solve, the problems set out. Knowing which provider organisations might have been funded through a particular donors money could be enough to help them target investigations in cases of fraud. Or knowing all the funders who have a stake in projects in a particular country, sector and locality can be enough for communities on the ground to do further research to identify the funders they need to talk to.
Rather than searching after a traceability data panopticon, can we focus traceability-enabling practices on breaking down the barriers to specific investigatory processes?
Ultimately, in the IATI case, getting traceability to work at the project level alone could be a big boost. But doing this will require a lot of social coordination, as much as technical innovation. As we think about tools for traceability, thinking about tools that support this social process may be an important area to focus on.
[Summary: reflections on responses to the GODAN discussion paper on agricultural open data, ownership and the commons – posted ahead of Africa Open Data Conference GODAN sessions]
Respondents to the paper have pointed to the way in which, in situations of unequal power, and in complex global markets, greater accessibility of data can have substantial downsides for farmers. For example, commodity speculation based on open weather data can drive up food prices, or open data on soil profiles can be used in order to extract greater margins from farmers when selling fertilizers. A number of responses to the ODI paper have noted that much of the information that feeds into emerging models of data-driven agriculture is coming from small-scale farmers themselves: whether through statistical collection by governments, or hoovered up by providers of farming technology, all aggregated into big datasets that practically inaccessible to local communities and farmers.
This has led to some focussing in response on the concept of data ownership: asserting that more emphasis should be placed on community ownership of the data generated at a local level. Equally, it has led to the argument that “opening data without enabling effective, equitable use can be considered a form of piracy”, making direct allusions to the biopiracy debate and the consequent responses to such concerns in the form of interventions such as the International Treaty on Plant Genetic Resources.
There are valid concerns here. Efforts to open up data must be interrogated to understand which actors stand to benefit, and to identify whether the configuration of openness sought is one that will promote the outcomes claimed. However, claims of data ownership and data sovereignty need to be taken as a starting point for designing better configurations of openness, rather than as a blocking counter-claim to ideas of open data.
Community ownership and openness
My thinking on this topic is shaped, albeit not to a set conclusion, by a debate that took place last year at a Berkman Centre Fellows Hour based on a presentation by Pushpa Kumar Lakshmanan on the Nagoya Protocol which sets out a framework for community ownership and control over genetic resources.
The debate raised the tension between the rights of communities to gain benefits from the resources and knowledge that they have stewarded, potentially over centuries, with an open knowledge approach that argues social progress is better served when knowledge is freely shared.
It also raised important questions of how communities can be demarcated (a long-standing and challenging issue in the philosophy of community rights) – and whether drawing a boundary to protect a community from external exploitation risks leaving internal patterns of power and exploitation within the community unexplored. For example, does community ownership of data really lead to certain elites in the community controlling it.
Ultimately, the debate taps into a conflict between those who see the greatest risk as being the exploitation of local communities by powerful economic actors, and those who see the greater risk as a conservative hoarding of knowledge in local communities in ways that inhibit important collective progress.
Exploring ownership claims
It is useful to note that much of the work on the Nagoya Protocol that Pushpa described was centred on controlling borders to regulate the physical transfer of plant genetic material. Thinking about rights over intangible data raises a whole new set of issues: ownership cannot just be filtered through a lens of possession and physical control.
Much data is relational. That is to say that it represents a relationship between two parties, or represents objects that may stand in ownership relationships with different parties. For example, in his response to the GODAN paper, Ajit Maru reports how “John Deere now considers its tractors and other equipment as legally ‘software’ and not a machine… [and] claims [this] gives them the right to use data generated as ‘feedback’ from their machinery”. Yet, this data about a tractor’s operation is also data about the farmers land, crops and work. The same kinds of ‘trade data for service’ concerns that have long been discussed with reference to social media websites are becoming an increasing part of the agriculture world. The concern here is with a kind of corporate data-grab, in which firms extract data, asserting their absolute ownership over something which is primarily generated by the farmer, and which is at best a co-production of farmer and firm.
It is in response to this kind of situation that grassroots data ownership claims are made.
These ownership claims can vary in strength. For example:
The farmer can claim that ‘this is my data’, and I should have ultimate control over how it is used, and the ability to treat it as a personally held asset;
The second runs that ‘I have a stake in this data’, and as a consequence, I should have access to it, and a say in how it is used;
Which claim is relevant depends very much on the nature of the data. For example, we might allow ownership claims over data about the self (personal data), and the direct property of an individual. For datasets that are more clearly relational, or collectively owned (for example, local statistics collected by agricultural extension workers, or weather data funded by taxation), the stakeholding claim is the more relevant.
It is important at this point to note that not all (perhaps even not many) concerns about the potential misuse of data can be dealt with effectively through a property right regime. Uses of data to abuse privacy, or to speculate and manipulate markets may be much better dealt with by regulations and prohibitions on those activities, rather than attempts to restrict the flow of data through assertions of data ownership.
Openness as a strategy
Once we know whether we are dealing with ownership claims, or stakeholding claims, in data, we can start thinking about different strategic configurations of openness, that take into account power relationships, and that seek to balance protection against exploitation, with the benefits that can come from collaboration and sharing.
For example, each farmer on their own has limited power vis-a-vis a high-tech tractor maker like John Deere. Even if they can assert a right to access their own data, John Deere will most likely retain the power to aggregate data from 1000s of farmers, maintaining an inequality of access to data vis-a-vis the farmer. If the farmer seeks to deny John Deere the right to aggregate their data with that of others: changes that (a) they will be unsuccessful, as making an absolute ownership claim here is difficult – using the tractor was a choice after all; and (b) they will potentially inhibit useful research and use of data that could improve cropping (even if some of the other uses of the data may run counter to the farmers interest). Some have suggested that creating a market in the data, where the data aggregator would pay the farmers for the ability to use their data, offers an alternative path here: but it is not clear that the price would compensate the farmer adequately, or lead to an efficient re-use of data.
However, in this setting openness potentially offers an alternative strategy. If farmers argue that they will only give data to John Deere if John Deere makes the aggregated data open, then they have the chance to challenge the asymmetry of power that otherwise develops. A range of actors and intermediaries can then use this data to provide services in the interests of the farmers. Both the technology provider, and the farmer, get access to the data in which they are both stakeholders.
This strategy (“I’ll give you data only if you make the aggregate set of data you gather open”), may require collective action from farmers. This may be the kind of arrangement GODAN can play a role in brokering, particularly as it may also turn out to be in the interest of the firm as well. Information economics has demonstrated how firms often under-share information which, if open, could lead to an expansion of the overall market and better equilibria in which, rather than a zero-sum game, there are benefits to be shared amongst market actors.
There will, however, be cases in which the power imbalances between data providers and those who could exploit the data are too large. For example, the above discussion assumes intermediaries will emerge who can help make effective use of aggregated data in the interests of farmers. Sometimes (a) the greatest use will need to be based on analysis of disaggregated data, which cannot be released openly; and (b) data providers need to find ways to work together to make use of data. In these cases, there may be a lot to learn from the history of commons and co-operative structures in the agricultural realm.
Co-operative and commons based strategies
Many discussions of openness conflate the concept of openness, and the concept of the commons. Yet there is an important distinction. Put crudely:
Open = anyone is free to use/re-use a resource;
Commons = mutual rights and responsibilities towards the resource;
In the context of digital works, Creative Commons provide a suite of licenses for content, some of which are ‘open’ (they place no responsibilities on users of a resource, but grant broad rights), and others of which adopt a more regulated commons approach, placing certain obligations on re-users of a document, photo or dataset, such as the responsibility to attribute the source, and share any derivative work under the same terms.
The Creative Commons draws upon an imagery from the physical commons. These commons were often in the form of land over which farmers held certain rights to graze cattle, of fisheries in which each fisher took shared responsibility for avoiding overfishing. Such commons are, in practice, highly regulated spaces – but that seek to pursue an approach based on sharing and stakeholding in resources, rather than absolute ownership claims. As we think about data resources in agriculture, reflecting more on learning from the commons is likely to prove fruitful. Of course, data, unlike land, is not finite in the same ways, nor does it have the same properties of excludability and rivalrousness.
In thinking about how to manage data commons, we might look towards another feature prevalent in agricultural production: that of the cooperative. The core idea of a data cooperative is that data can be held in trust by a body collectively owned by those who contribute the data. Such data cooperatives could help manage the boundary between data that is made open at some suitable level of aggregation, and data that is analysed and used to generate products of use to those contributing the data.
With Open Data Services Co-operative I’ve just started to dig more into learning about the cooperative movement: co-founding a workers cooperative that supports open data projects. However, we’ve also been thinking about how data cooperatives might work – and I’m certain there is scope for a lot more work in this area, helping deal with some of the critical questions that have come up for open data from the GODAN discussion paper.
[Summary: Brief notes exploring a strategic and service-based approach to improve IATI data quality]
Filed under: rough ideas
At the International Aid Transparency Initiative (IATI) Technical Advisory Group meeting (#tag2015) in Ottawa last week I took part in two sessions exploring the need for Application Programming Interfaces (APIs) onto IATI data. It quickly became clear that there were two challenges to address:
(1) Many of the questions people around the table were asking were complex queries, not the simple data retrieval kinds of questions that an API is well suited to;
(2) ‘Out of the box’ IATI data is often not able to answer the kinds of questions being asked, either because
(a) the quality and consistency of data from distributed sources means that there are a range of special cases to handle when performing cross-donor analysis;
(b) the questions asked invite additional data preparation, such as currency conversion, or identifying a block of codes that relate to a particular sector (.e.g. identifying all the Water and Sanitation related codes)
These challenges also underlie the wider issue explored at TAG2015: that even though five years of effort have gone into data supply, few people are actually using IATI data day-today.
If the goal of the International Aid Transparency Initiative as a whole, distinct from the specific goal of securing data, is more informed decision making in the sector, then this got me thinking about the extent to which what we need right now is a primary focus on services rather than data and tools. And from that, thinking about whether intelligent funding of such services could lead to the right kinds of pressures for improving data quality.
Improving data through enquiries
Using any dataset to answer complex questions takes both domain knowledge, and knowledge of the data. Development agencies might have lots of one-off and ongoing questions, from “Which donors are spending on Agriculture and Nutrition in East Africa?”, to “What pipeline projects are planned in the next six months affecting women and children in Least Developed Countries?”. Against a suitably cleaned up IATI dataset, reasonable answers to questions like these could be generated with carefully written queries. Authoriative answers might require further cleaning and analysis of the data retrieved.
For someone working with a dataset every day, such queries might take anything from a few minutes to a few hours to develop and execute. Cleaning data to provide authoritative answers might take a bit longer.
For a programme officer, who has the question, but not the knowledge of the data structures, working out how to answer these questions might take days. In fact, the learning curve will mean often these questions are simply not asked. Yet, having the answers could save months, and $millions.
So – what if key donors sponsored an enquiries service that could answer these kinds of queries on demand? With the right funding structure, it could have incentives not only to provide better data on request, but also to put resources into improving data quality and tooling. For example: if there is a set price paid per enquiry successfully answered, and the cost of answering that enquiry is increased by poor data quality from publishers, then there can be an incentive on the service to invest some of it’s time in improving incoming data quality. How to prioritise such investments would be directly connected to user demand: if all the questions are made trickier to answer because of a particular donor’s data, then focussing on improving that data first makes most sense. This helps escape the current situation in which the goal is to seek perfection for all data. Beyond a certain point, the political pressures to publish may ceases to work to increase data quality, whereas requests to improve data that are directly connected to user demand and questions may have greater traction.
Of course, the incentive structures here are subtle: the quickest solution for an enquiry service might be to clean up data as it comes into its own data store rather than trying to improve data at source – and there remains a desire in open data projects to avoid creating single centralised databases, and to increase the resiliency of the ecosystem by improving original open data, which would oppose this strategy. This would need to be worked through in any full proposal.
I’m not sure what appetite there would be for a service like this – but I’m certain that in, what are ultimately niche open data ecosystems like IATI, strategic interventions will be needed to build the markets, services and feedback loops that lead to their survival.
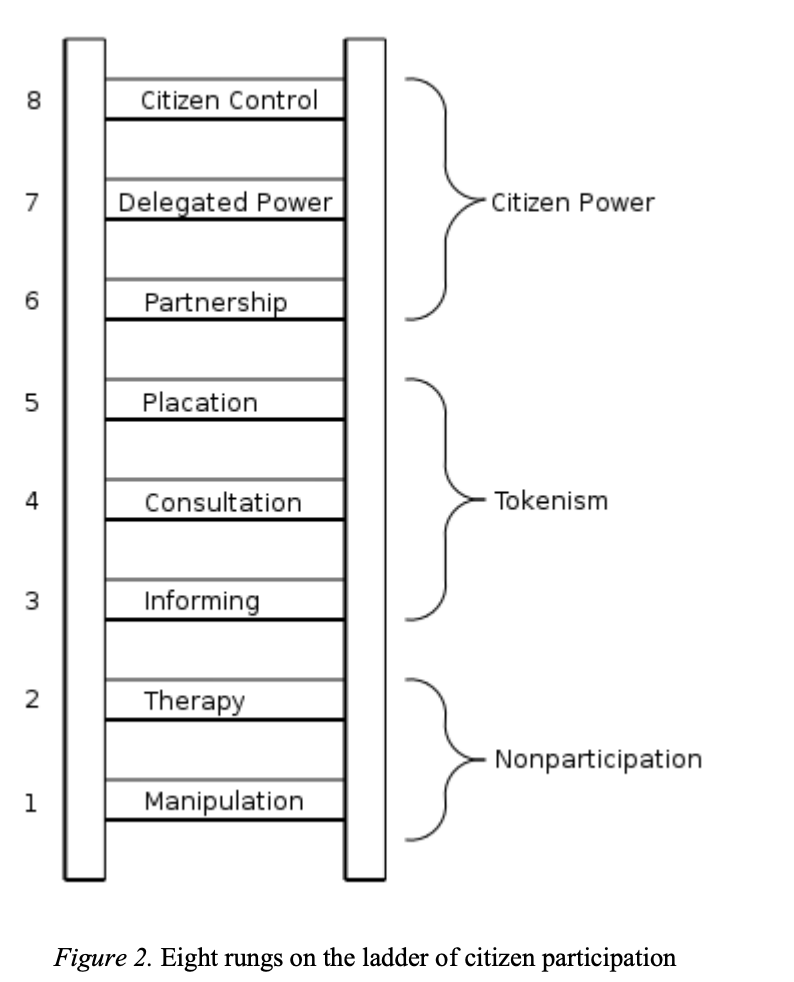
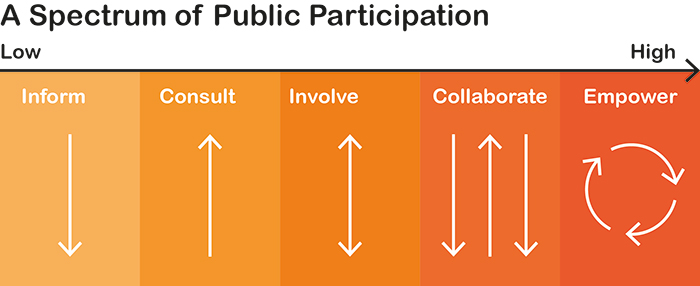
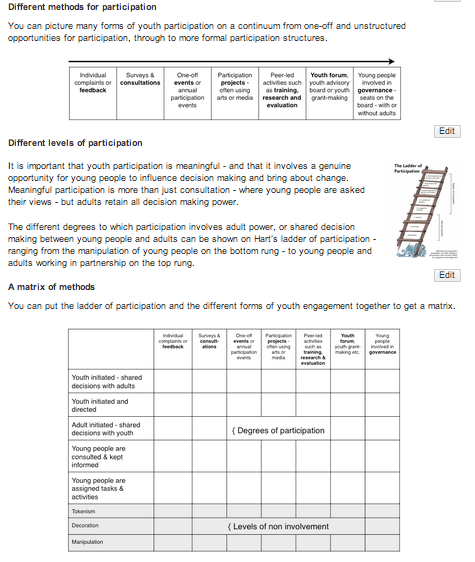
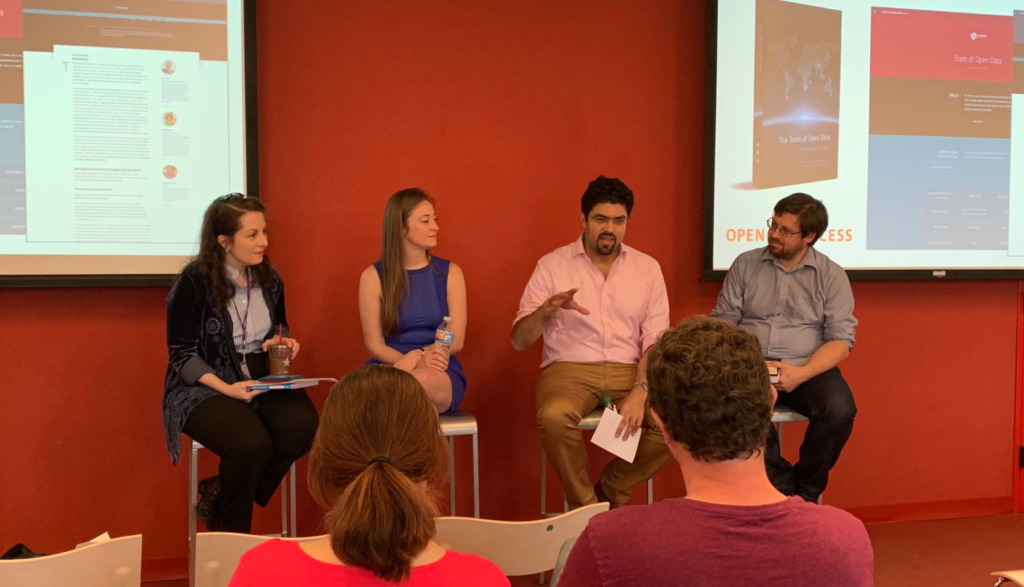
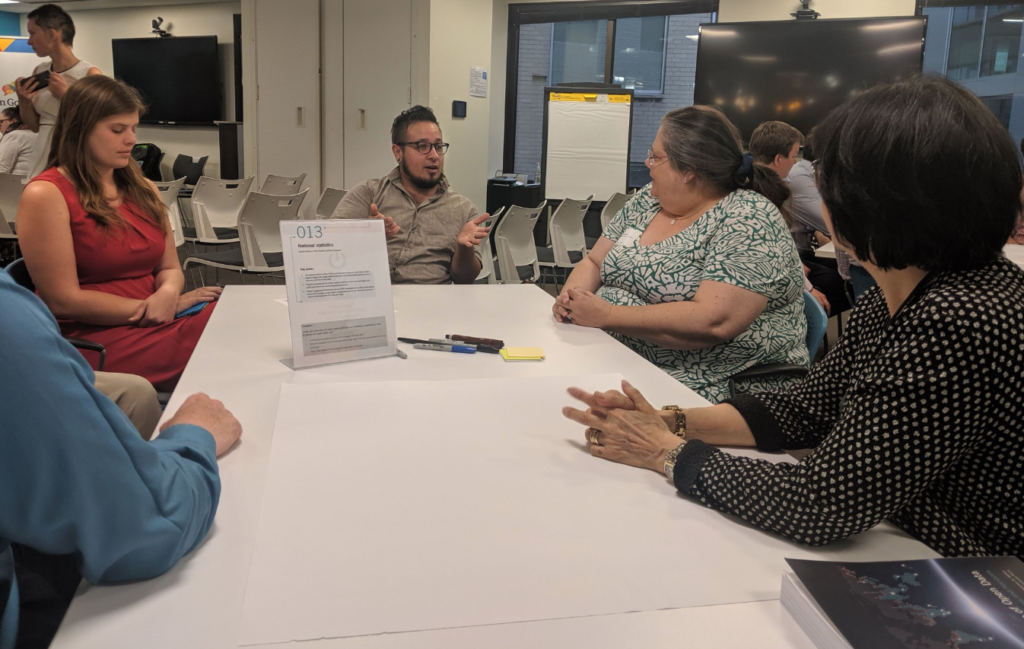
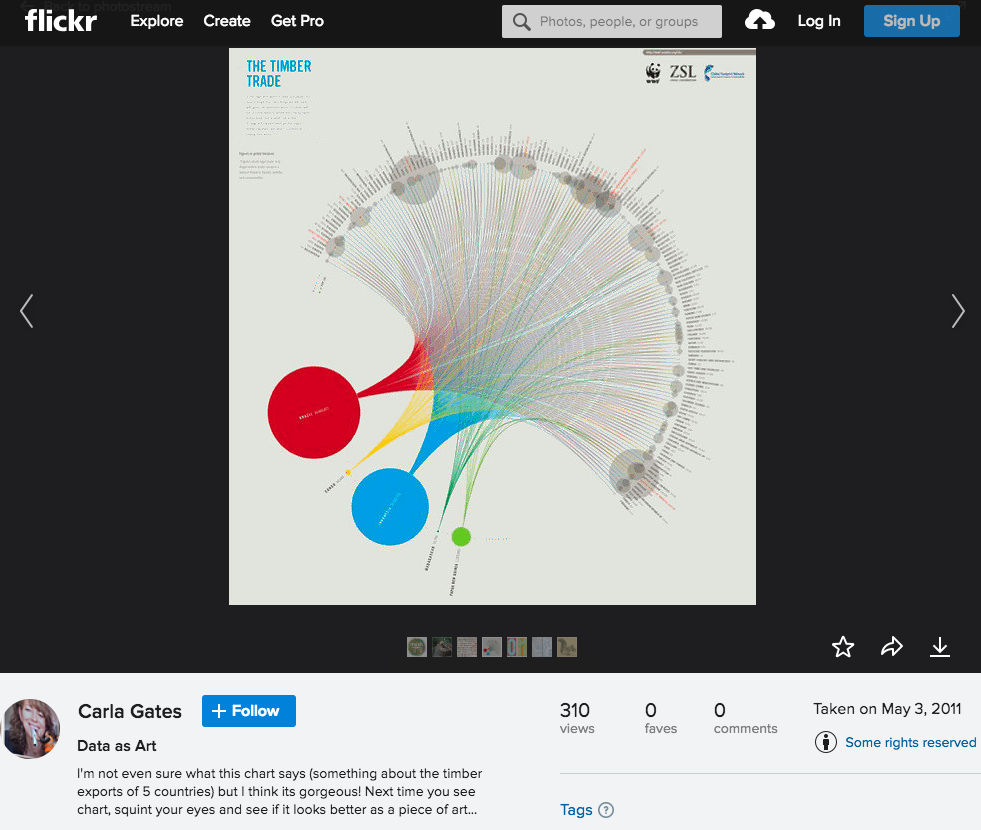
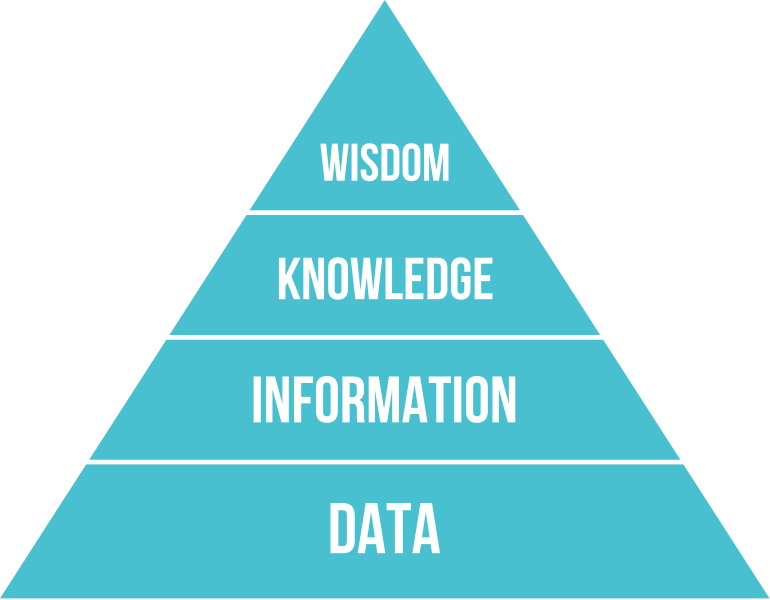
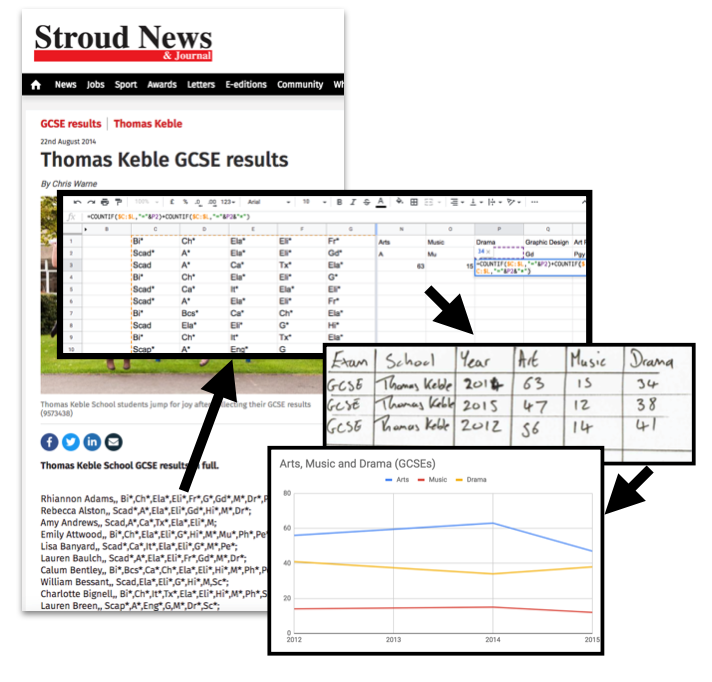

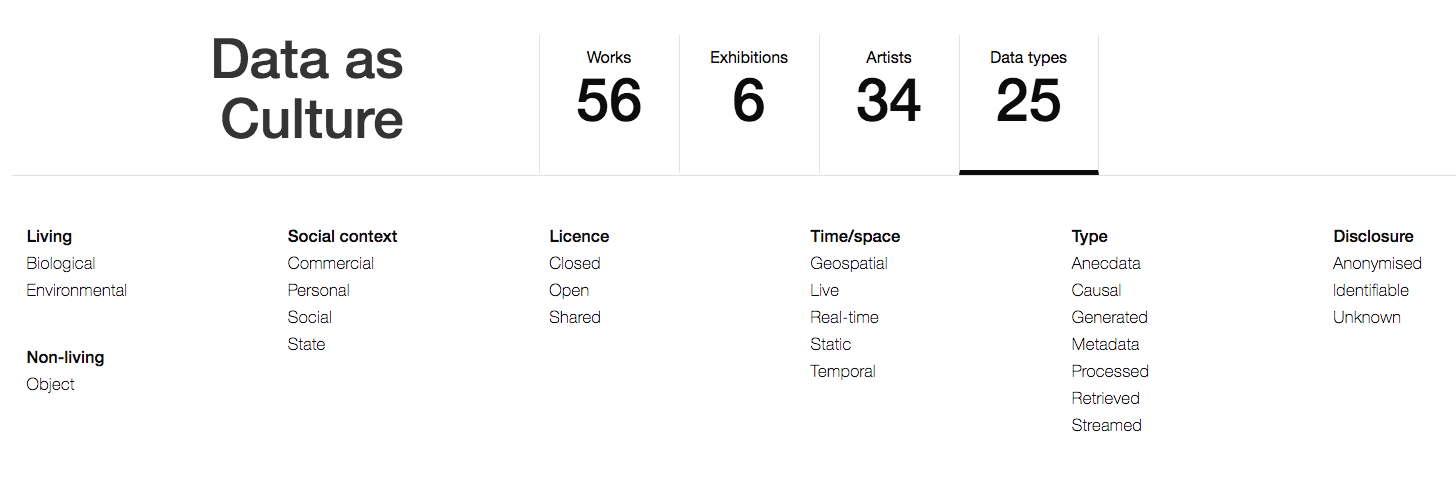
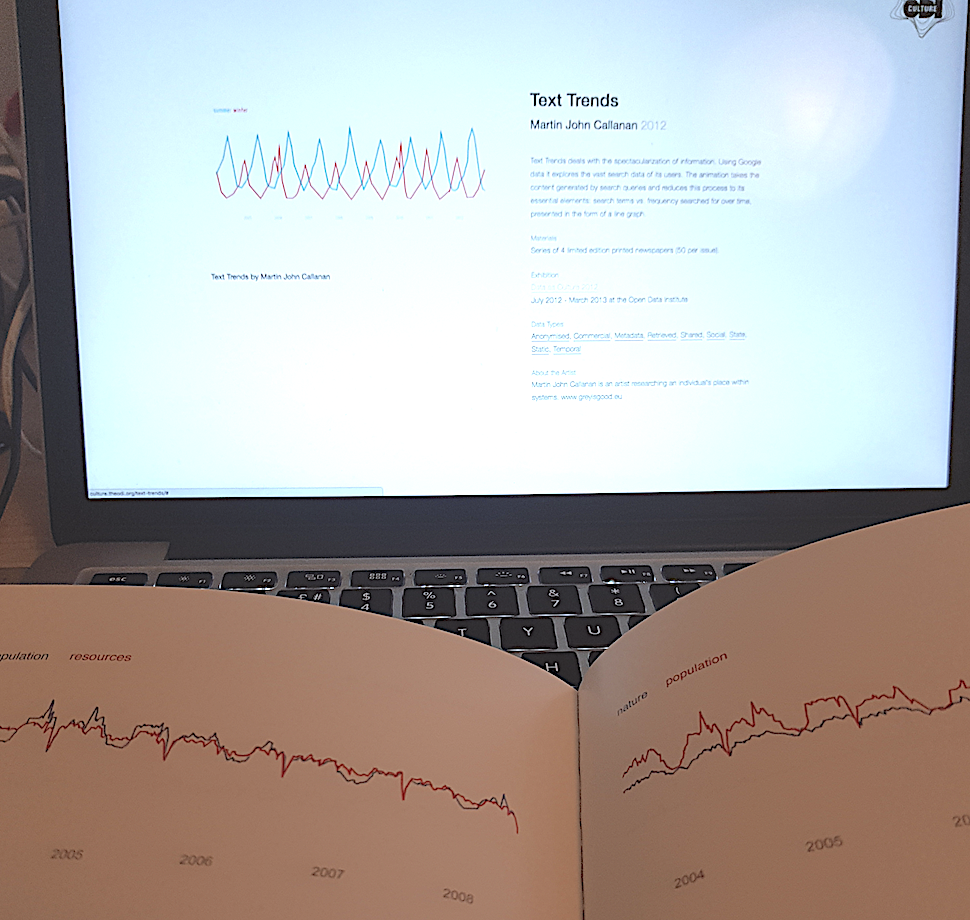
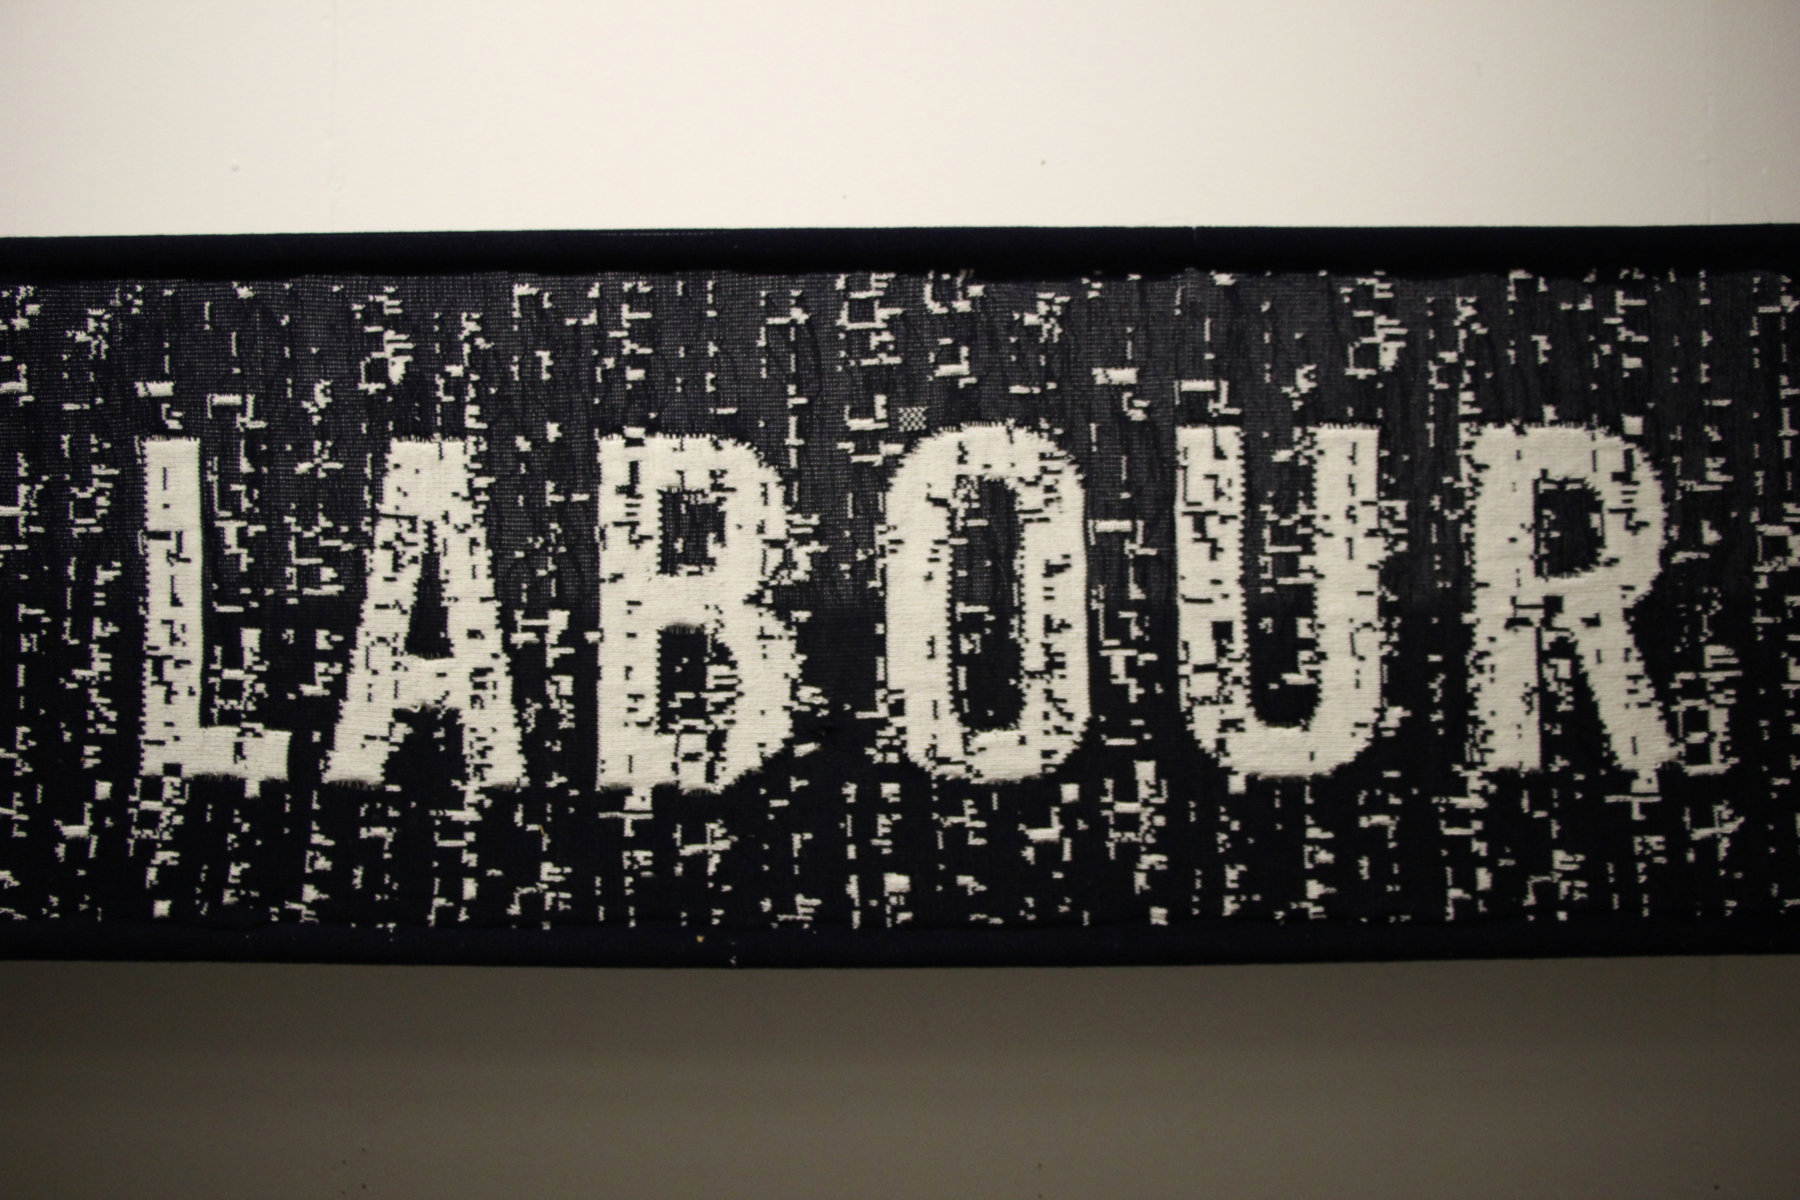

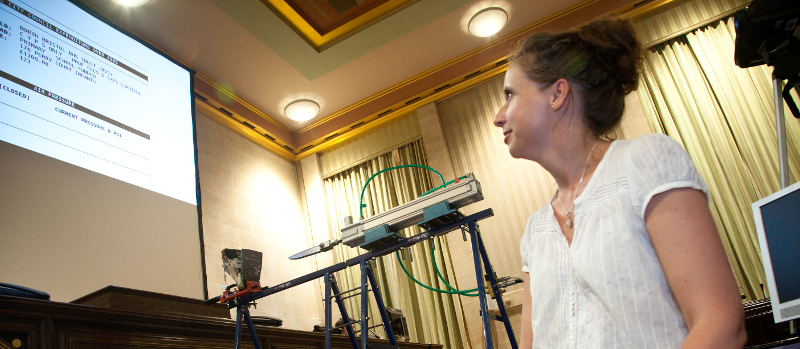
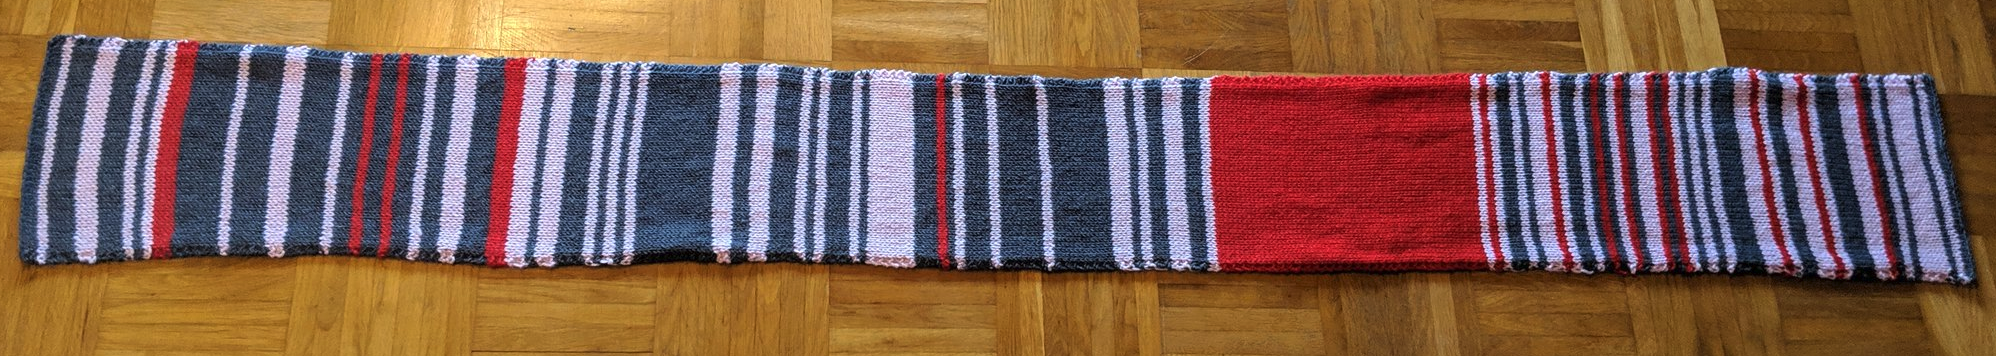
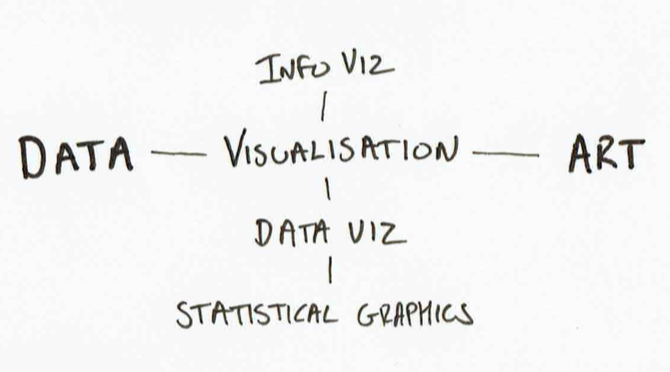
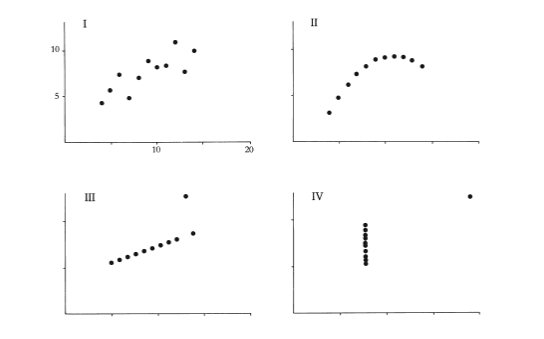
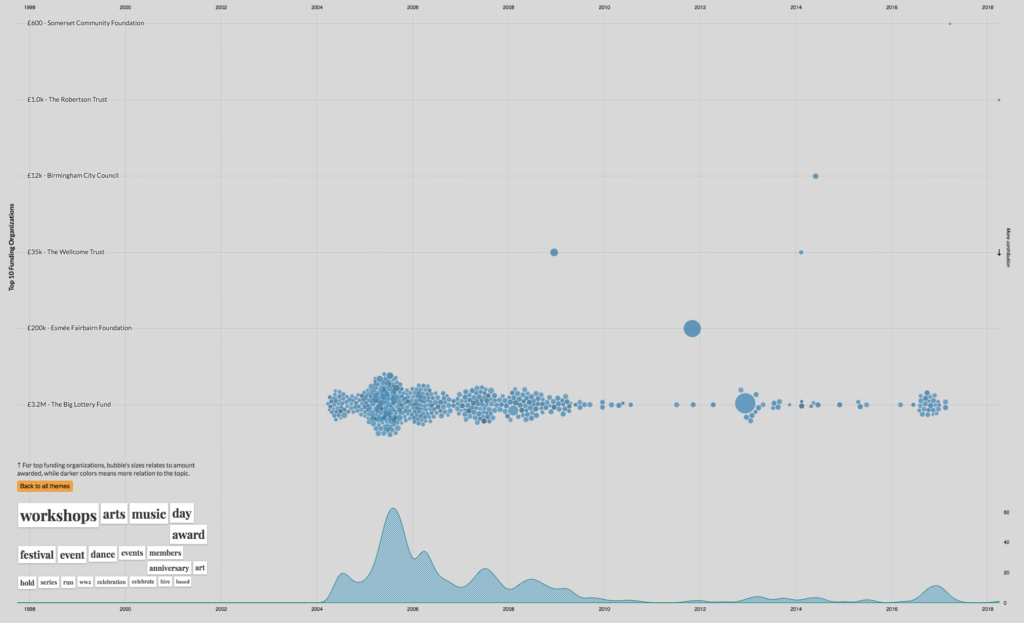


